Phylo.io Manual
< Back to Phylo.ioIntroduction
Phylo.io is a state of the art tool for visualising and comparing phylogenetic trees on the web. It can be used to view a single tree, or compare the internal structure of two differently inferred trees for the same group of taxons. Phylo.io includes a number of useful features to make the viewing and comparing of even very large trees extremely easy.
Viewing a Single Tree
To view a single tree, put Phylo.io in 'View' mode by clicking the view button in the view/compare tab at the top of the sidebar as shown in Fig. 1. Then paste in the Newick code for your tree as shown in Fig. 2 and click 'Render'.
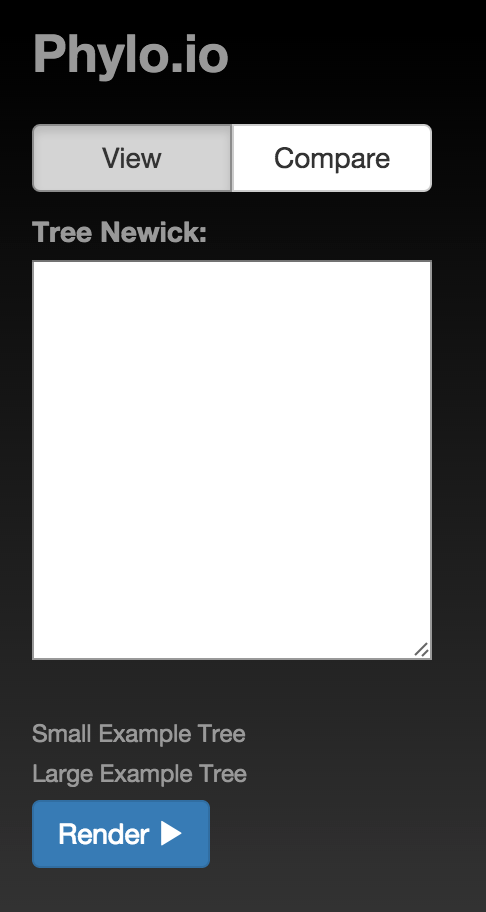
Fig. 1
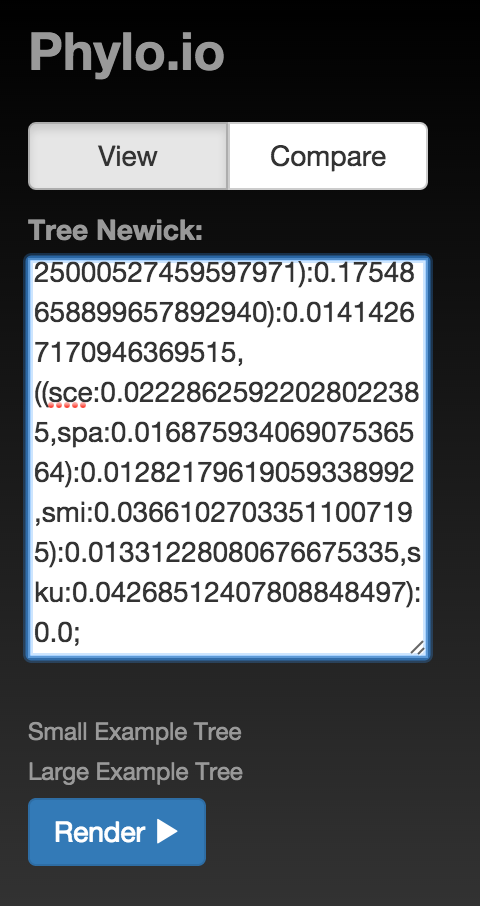
Fig. 2
Your tree will now appear in the viewing area as shown in Fig 3.
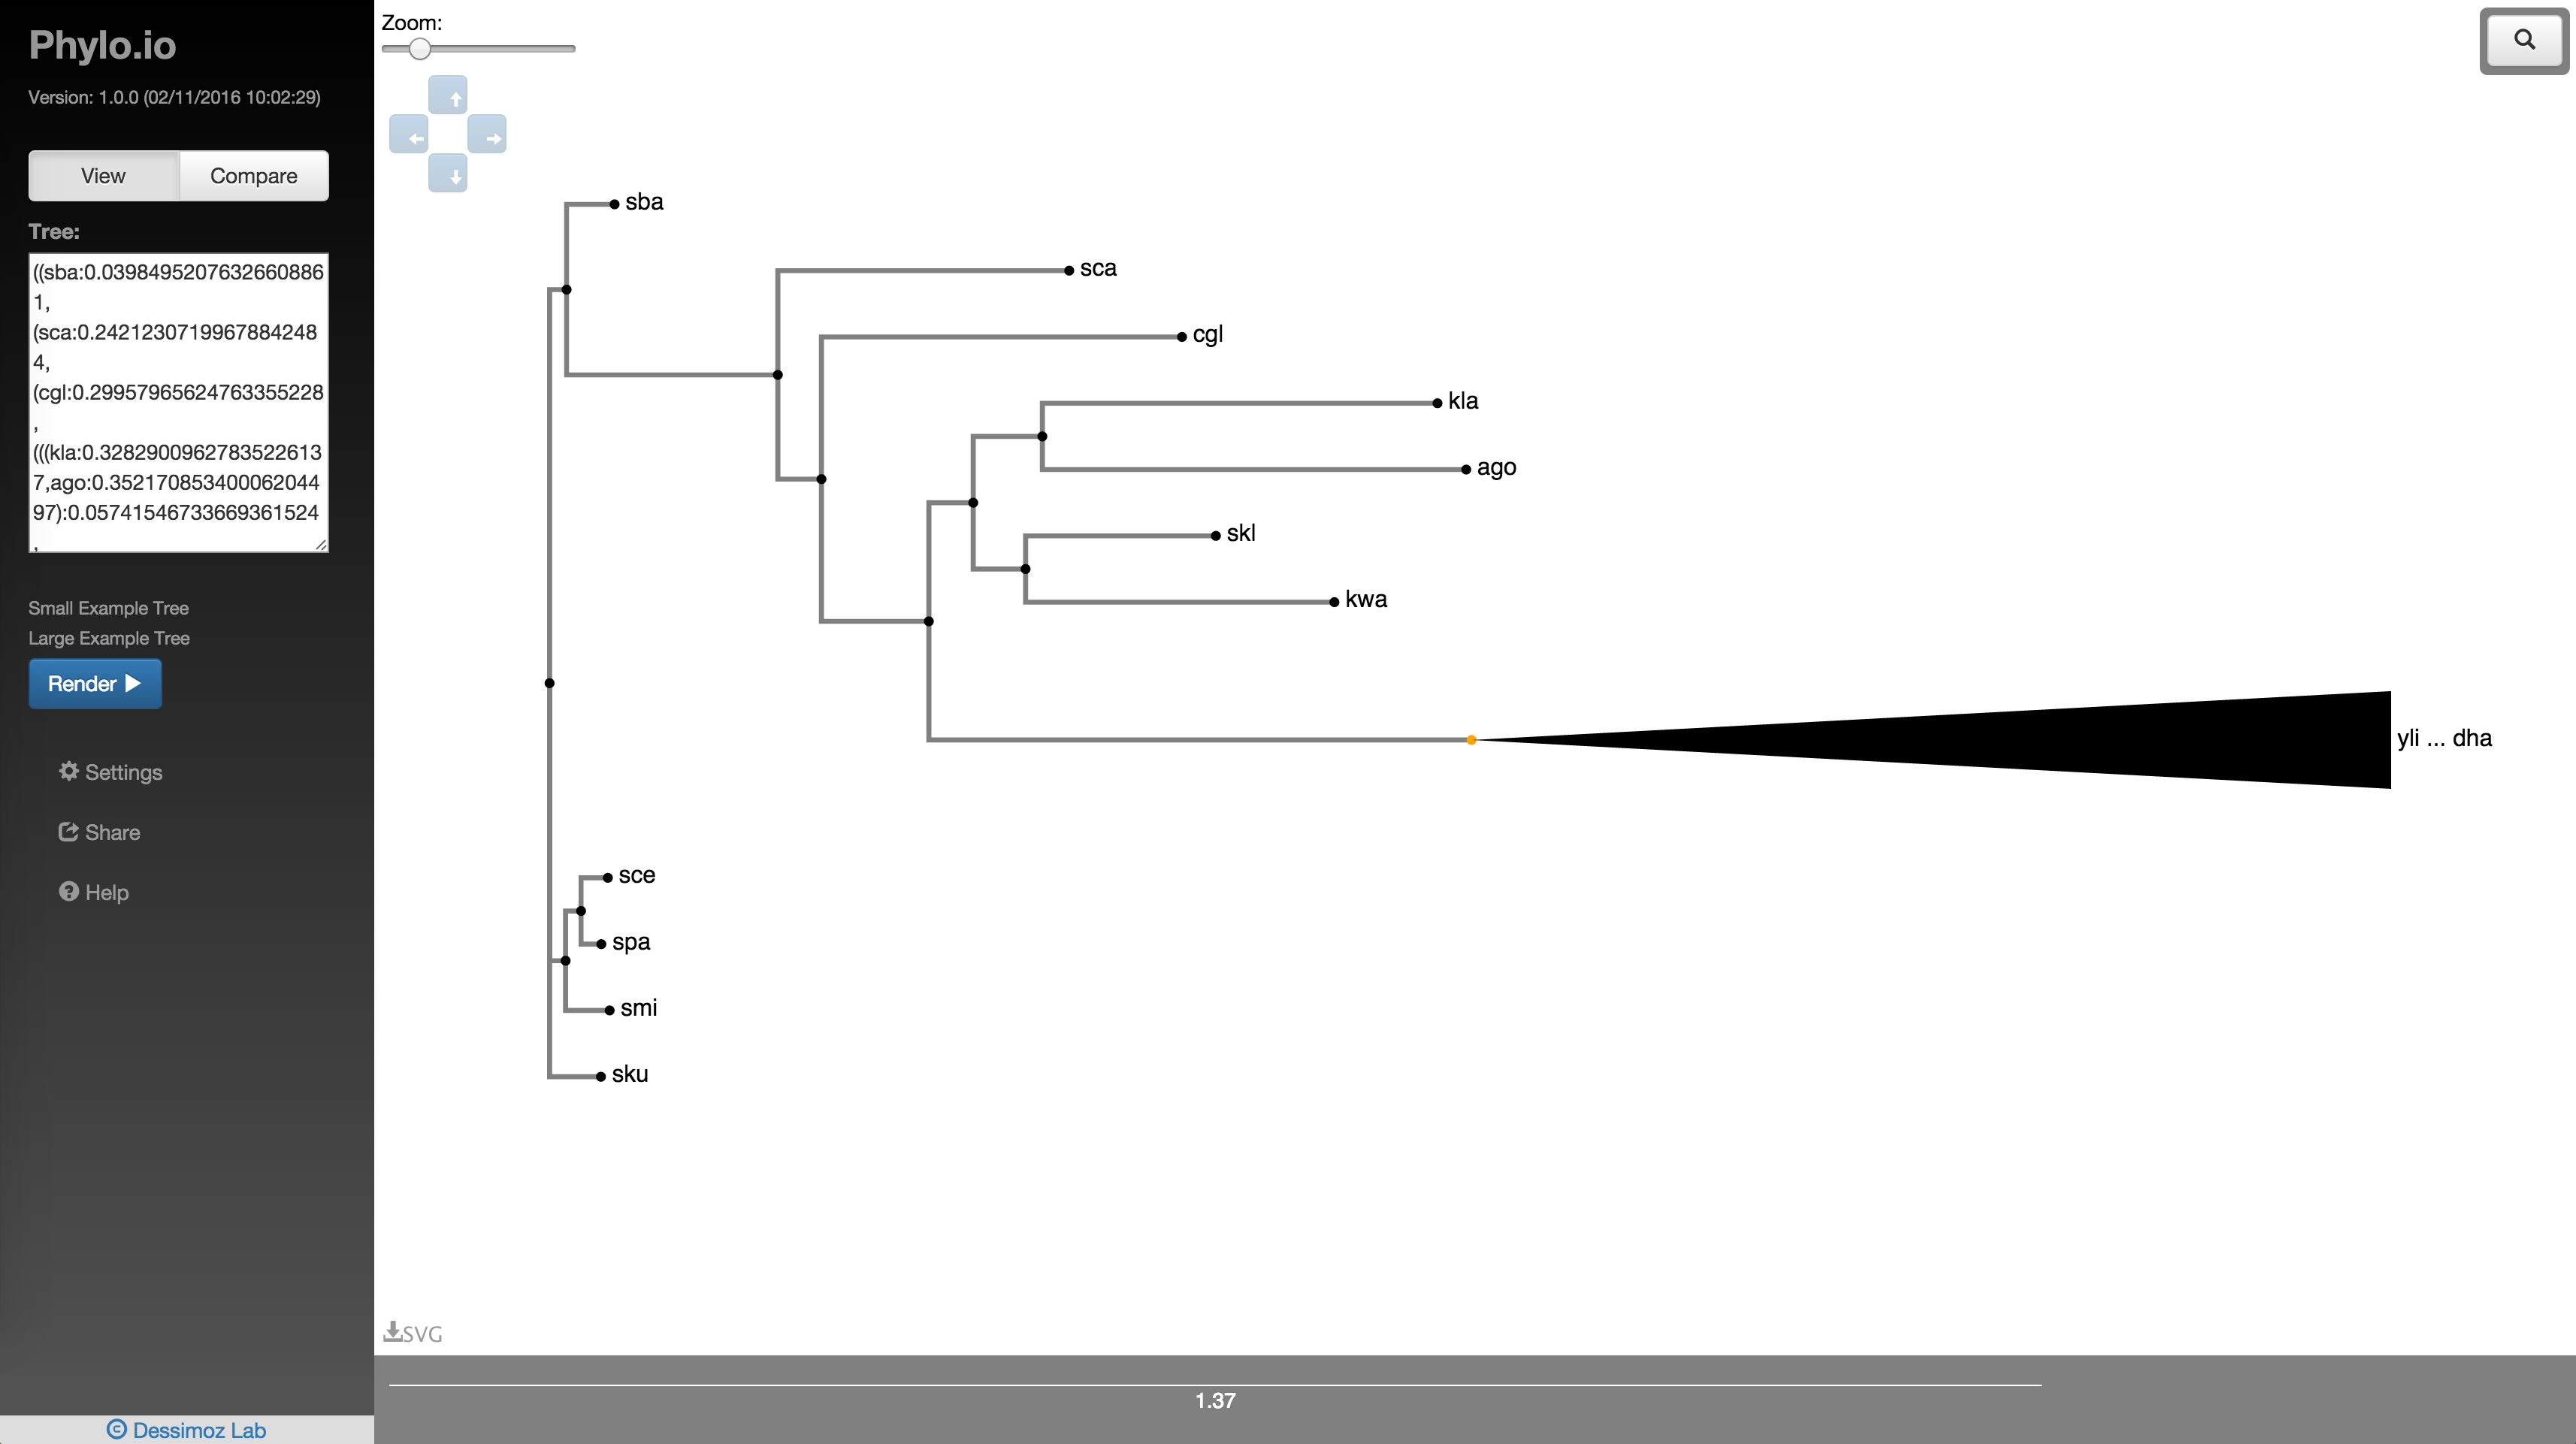
Fig. 3
Using the visualisation
By default, the tree is collapsed beyond a depth of 3. A collapsed node is denoted by a triangle as seen in Fig. 3. The collapse depth can be changed using the option in the settings panel as shown in Fig. 4. Also, clicking a node gives an array of options as seen in Fig. 5. 'Uncollapse' uncollapses the single node and 'Uncollapse All' uncollapses all nodes in that node's subtree.
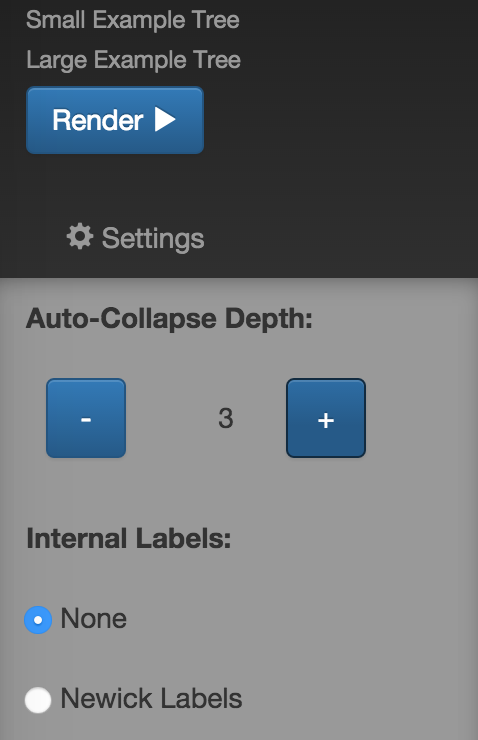
Fig. 4
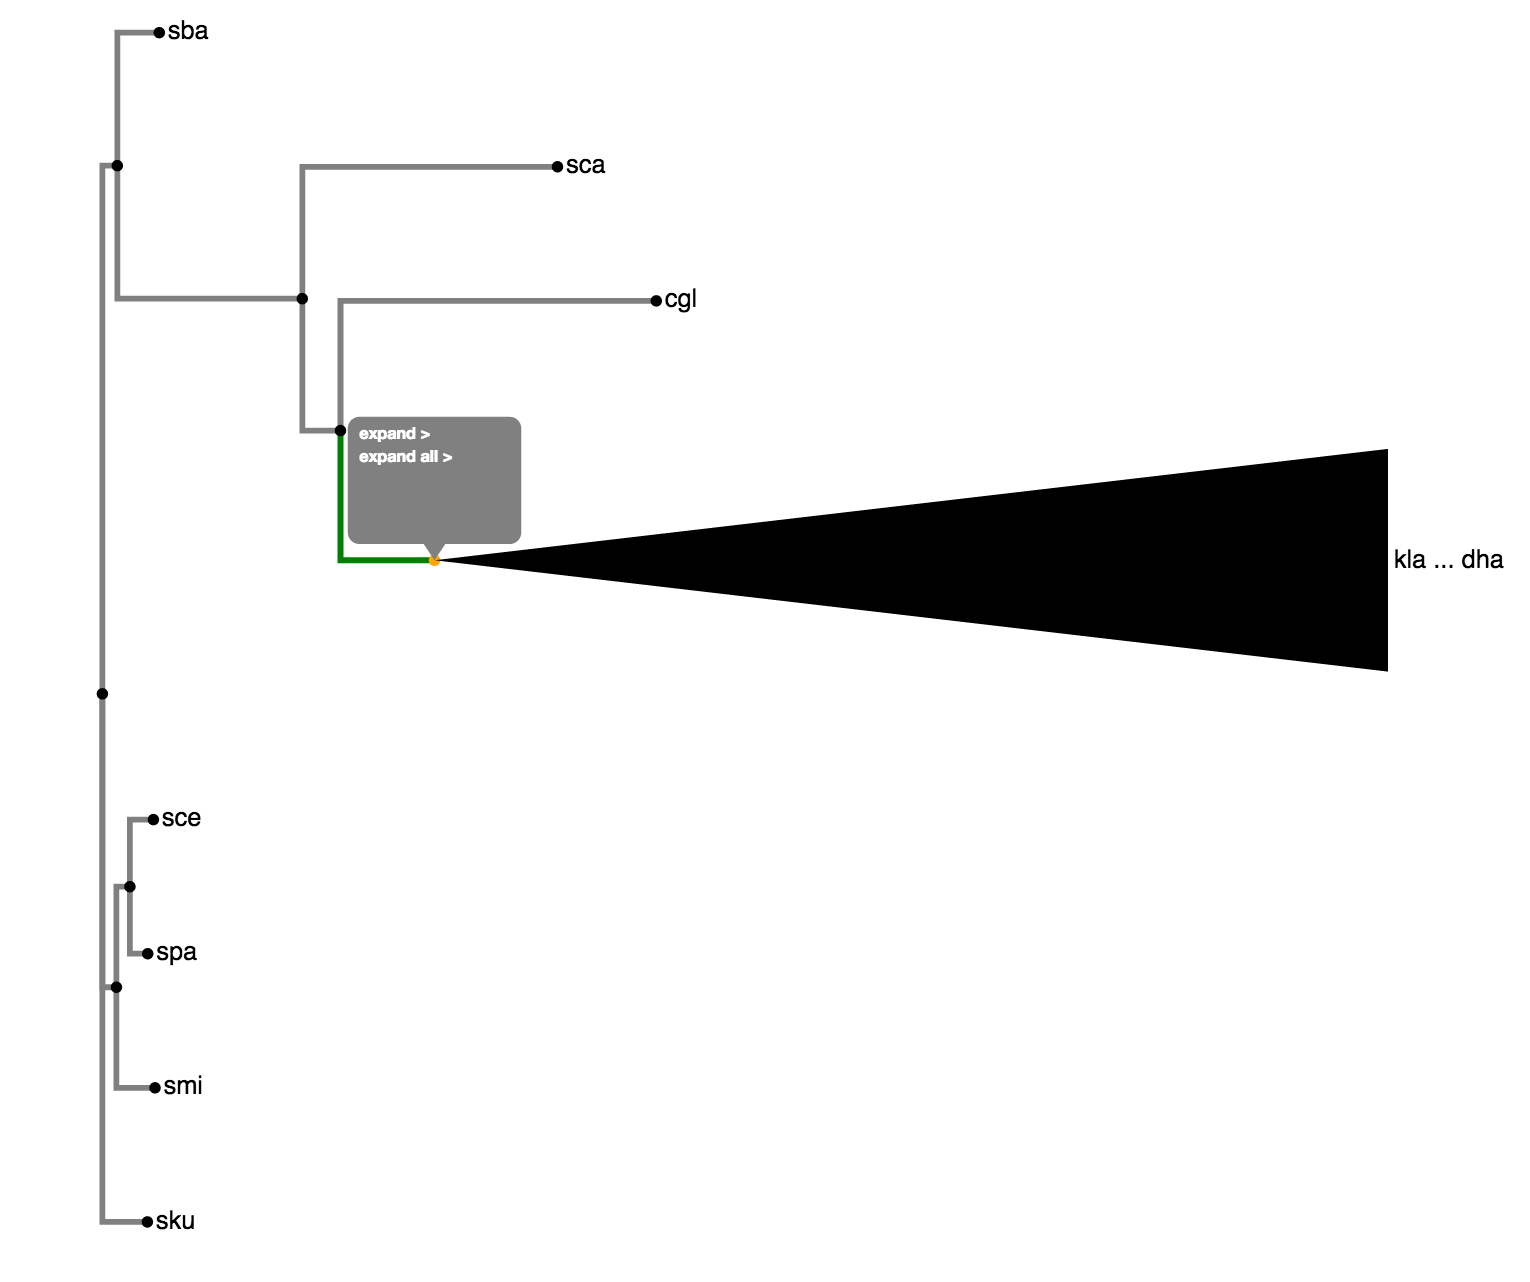
Fig. 5
There are a number of controls overlayed on the visualisation that allow the visualisation to be manipulated. Fig. 6A is the zoom control. Zooming of the tree can either be done using this slider or using the scroll wheel on your mouse. Fig. 6B shows the tree size controls. These can be used to manipulate the vertical and horizontal spacing of the tree to improve legibility of nodes if they are bunched together in very large trees. Fig. 6C is the search box which is discussed in the next section. Clicking the 'Download as SVG' button shown in Fig. 6D allows you to download the parts of the tree currently visible in the visualisation container in SVG format.
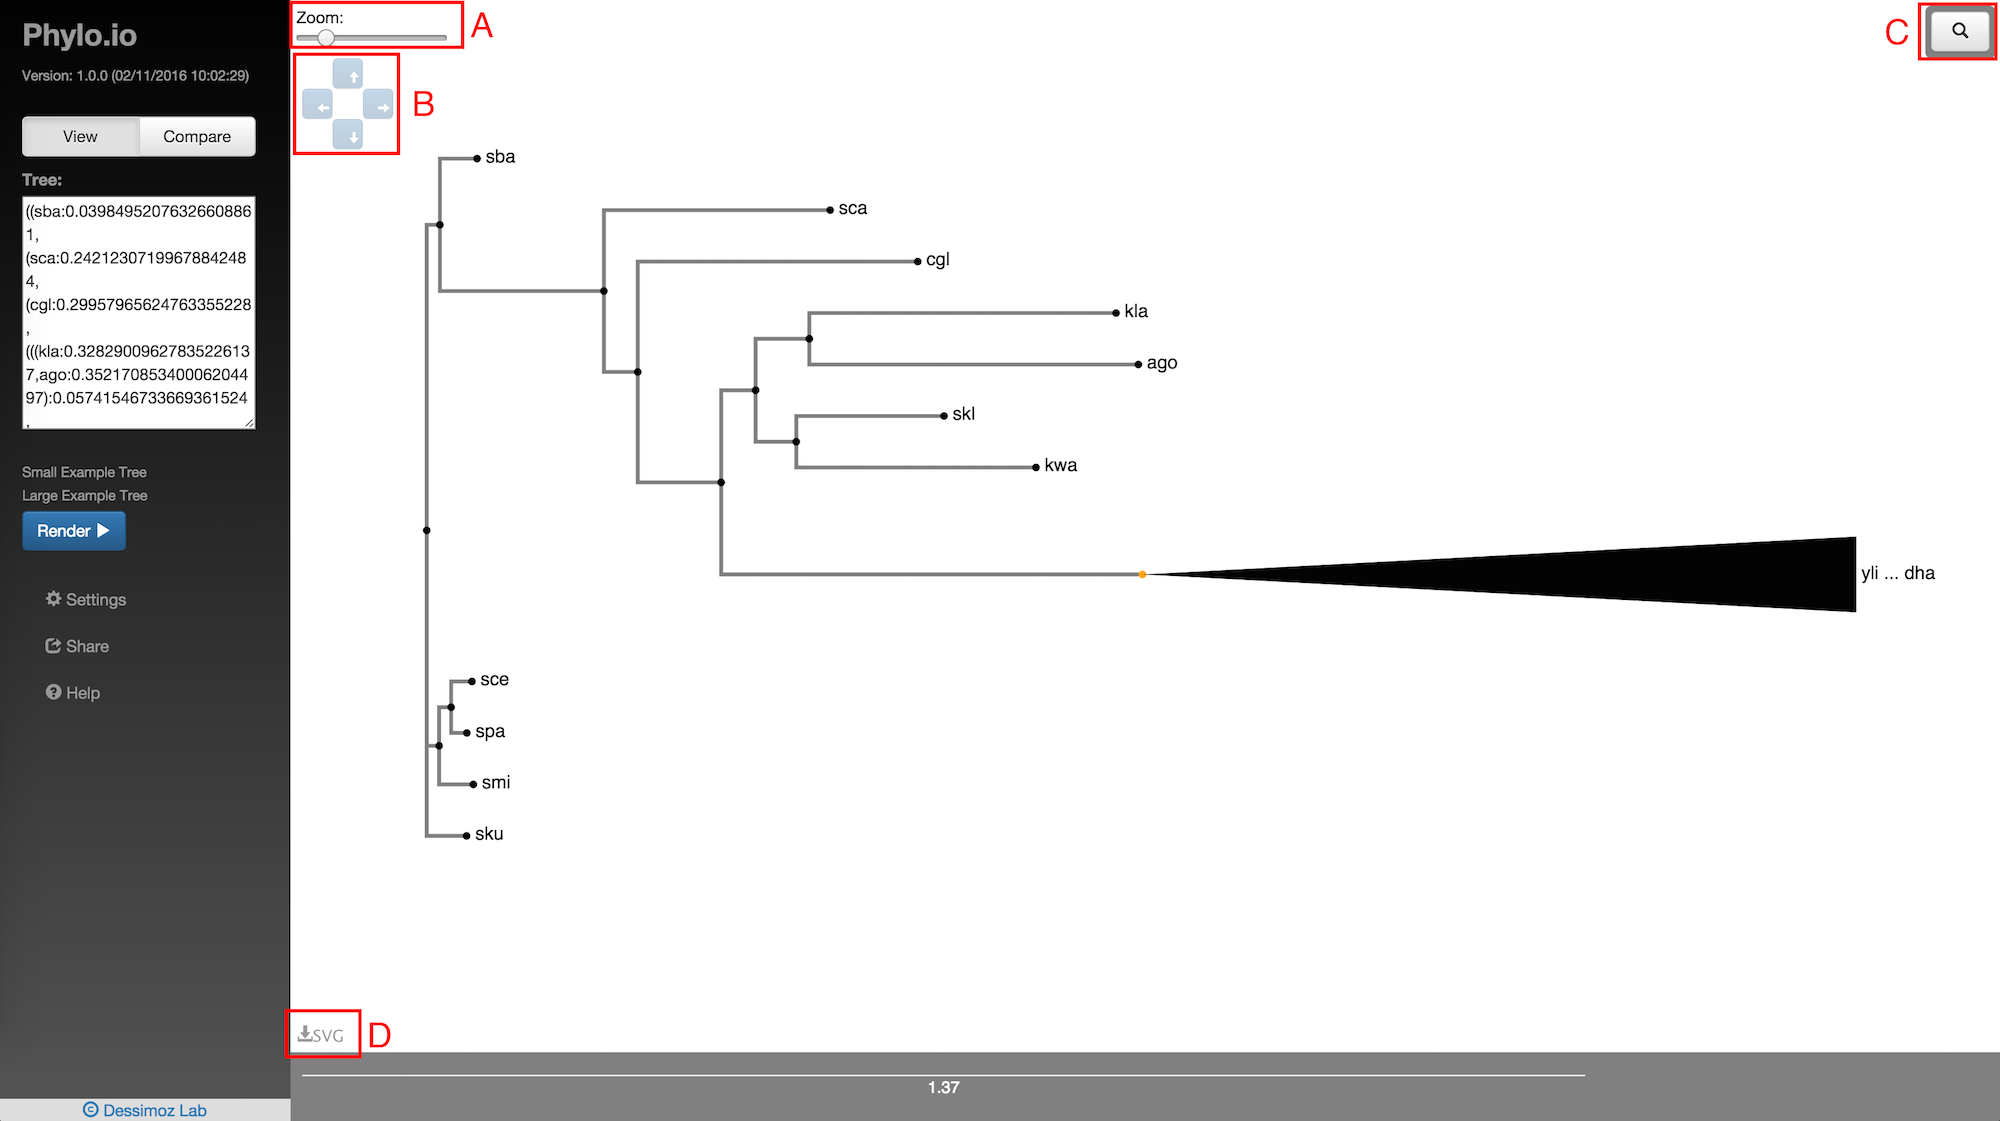
Fig. 6
Search
Clicking the button in Fig. 6C brings up the search box. If you start typing in here, suggested results will appear instantly. Click on the taxon you are looking for and its position in the tree will be highlighted in red along with the path to that leaf from the root of the tree as shown in Fig. 7. If the leaf is in a subtree that is currently collapsed, that subtree will be uncollapsed. Clicking the highlighted leaf node will clear the highlighting.
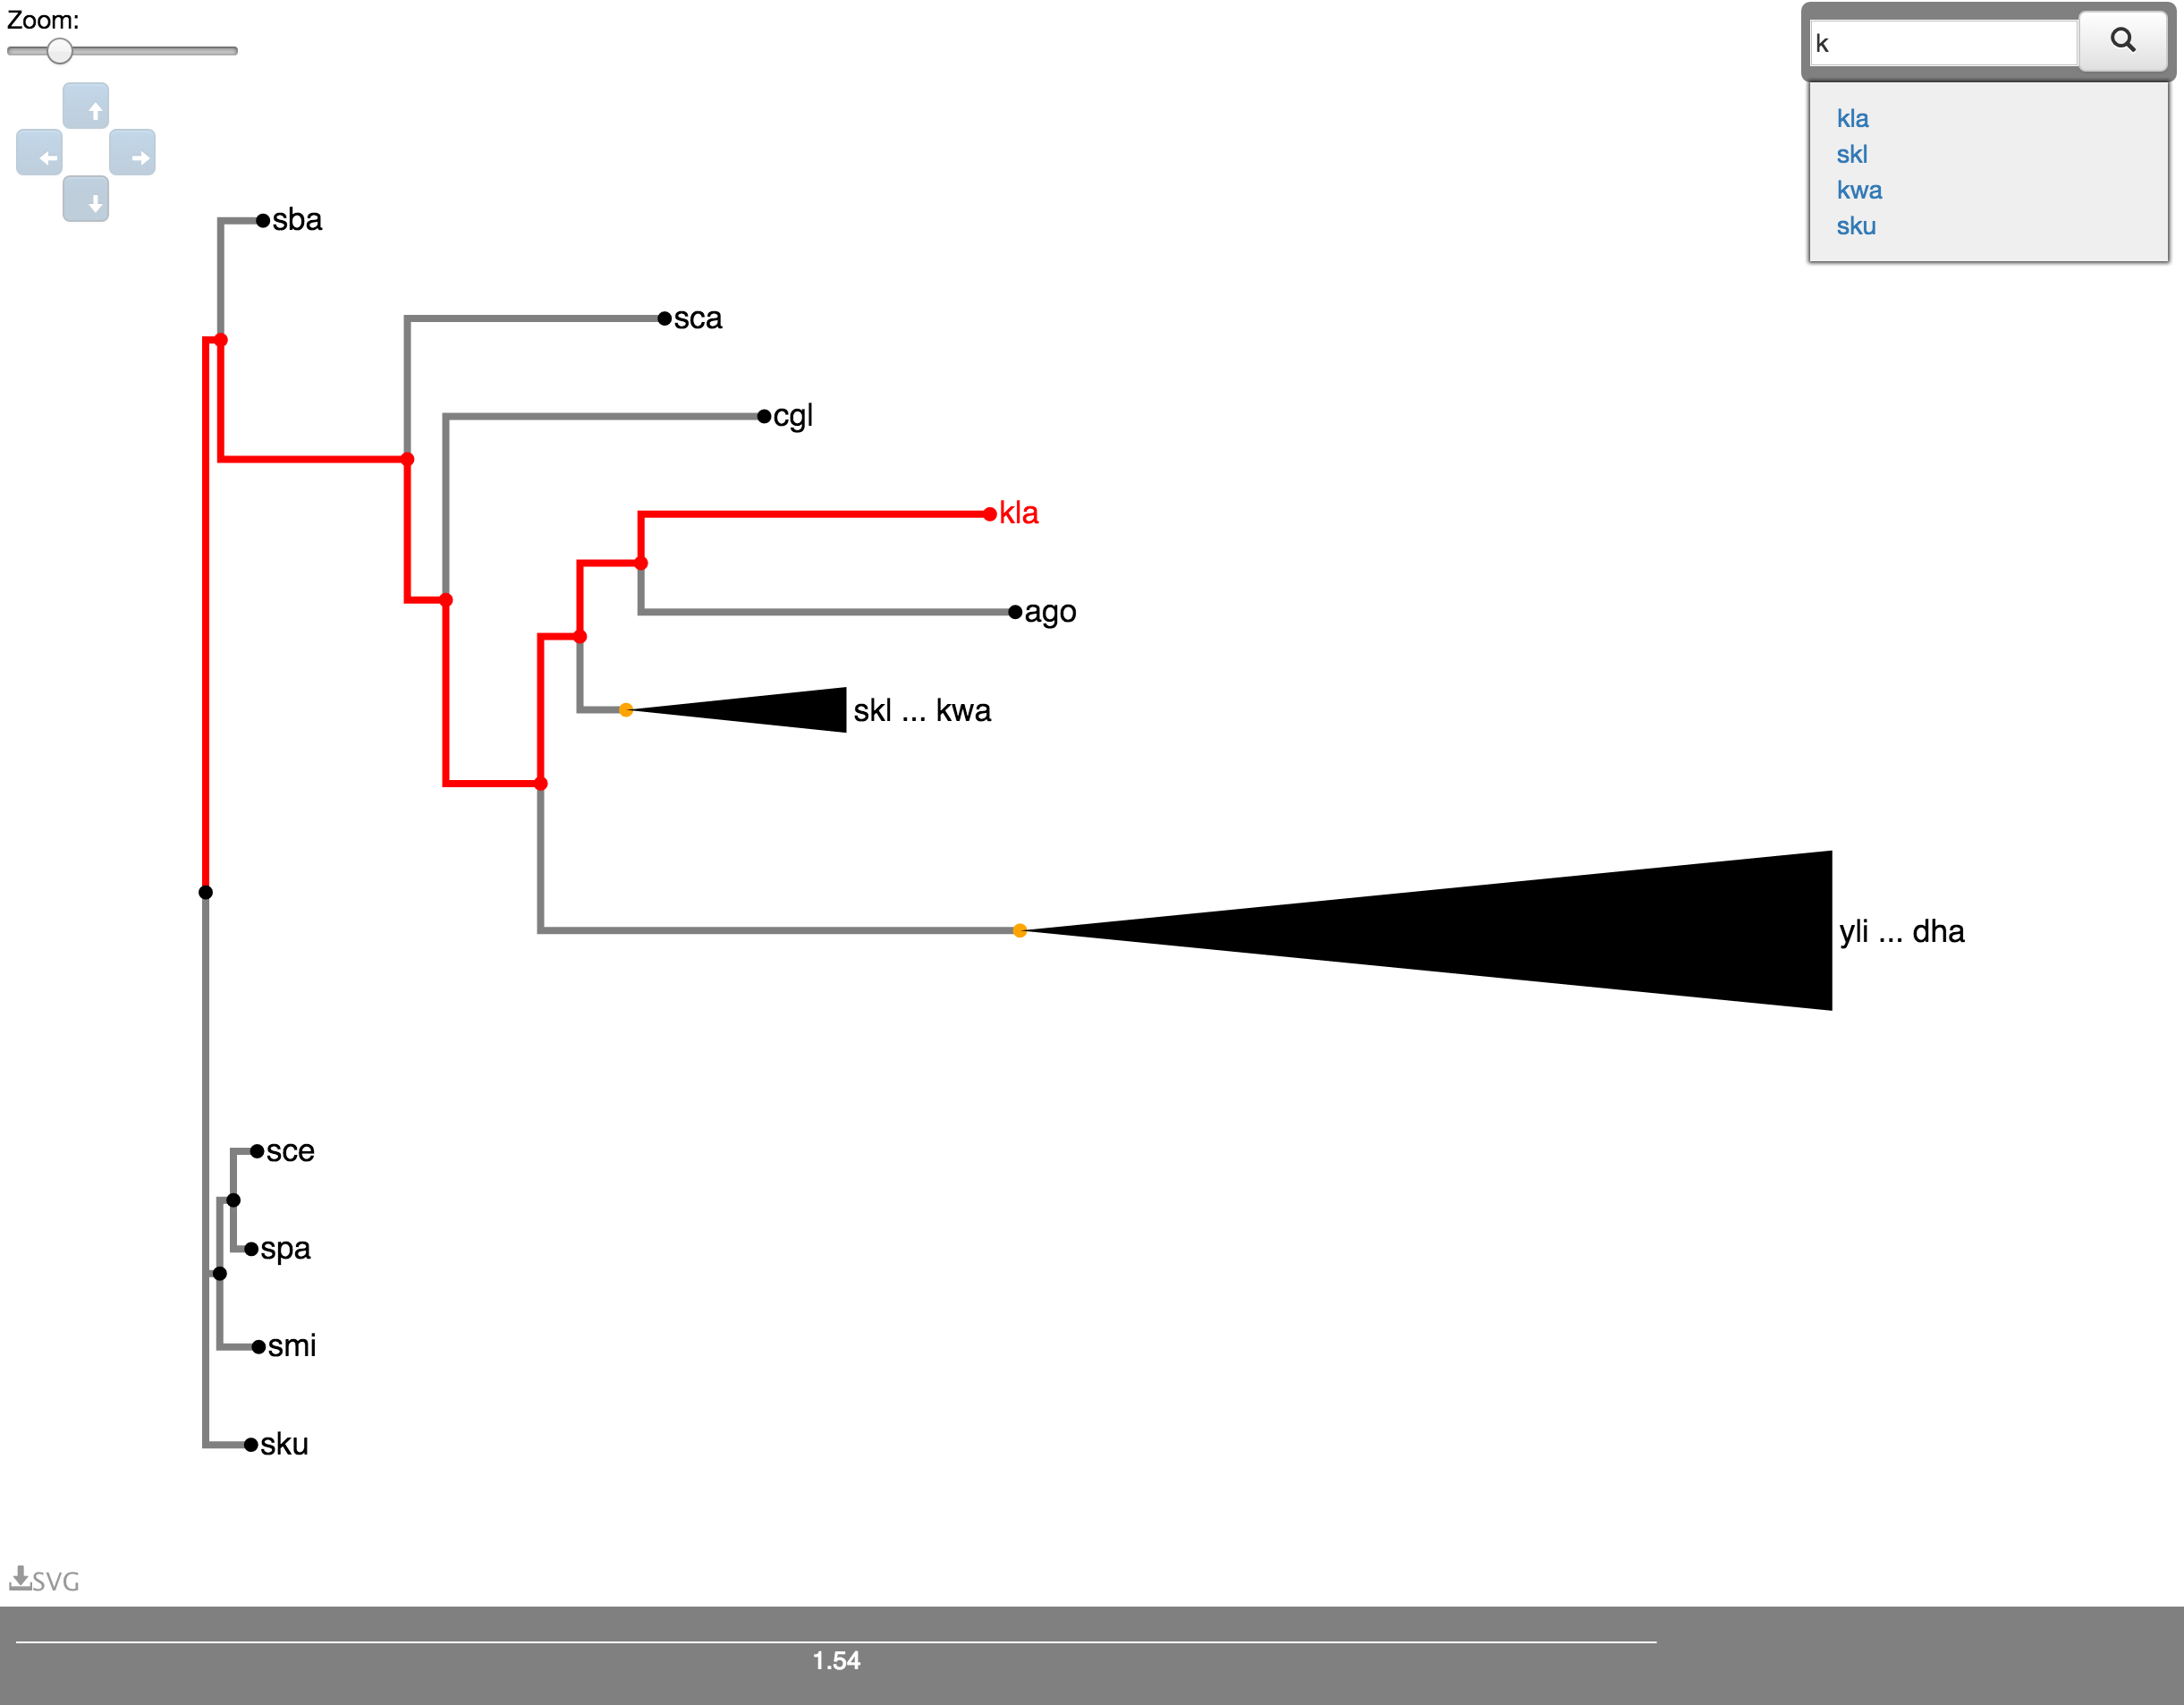
Fig. 7
Scale
Underneath each tree visualised, a dyanmic scale is drawn showing the length metric for that tree (Fig. 8). This updates in real time as you zoom in and explore the tree. Alternatively, if you want to view the tree without the branch lengths taken into account, you can turn this off in settings (Fig. 9). If lengths are turned off, the visualisation will update in real time to reflect this.
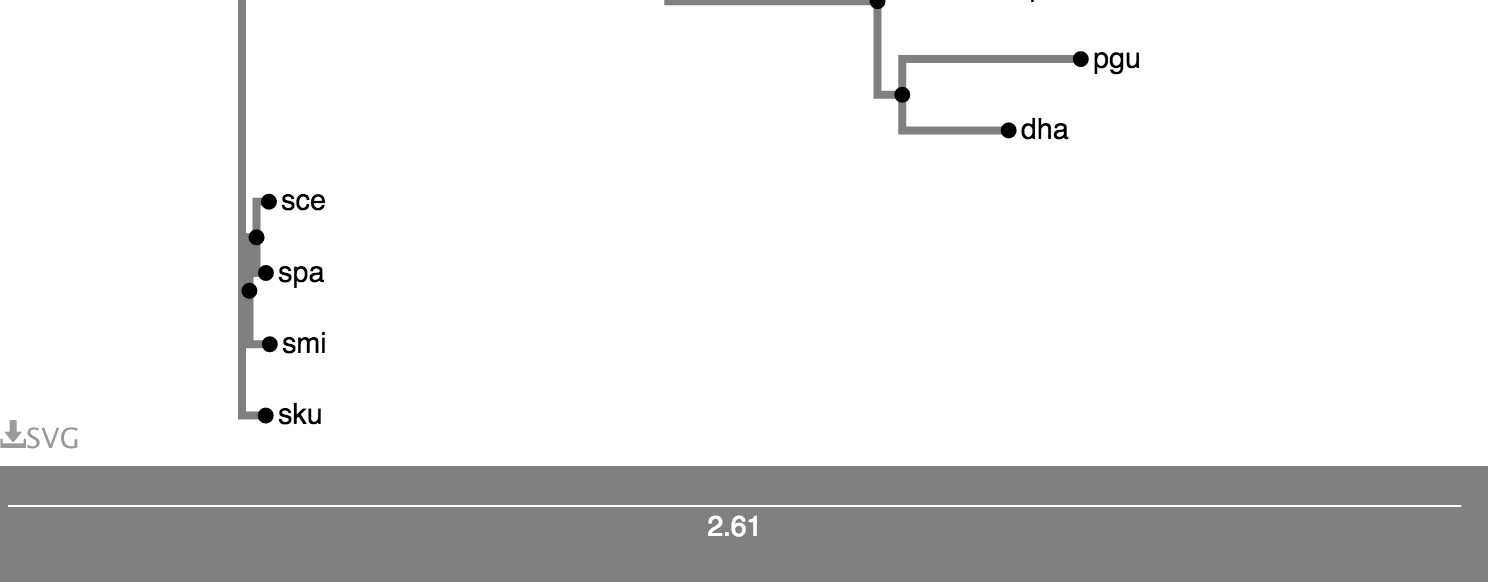
Fig. 8
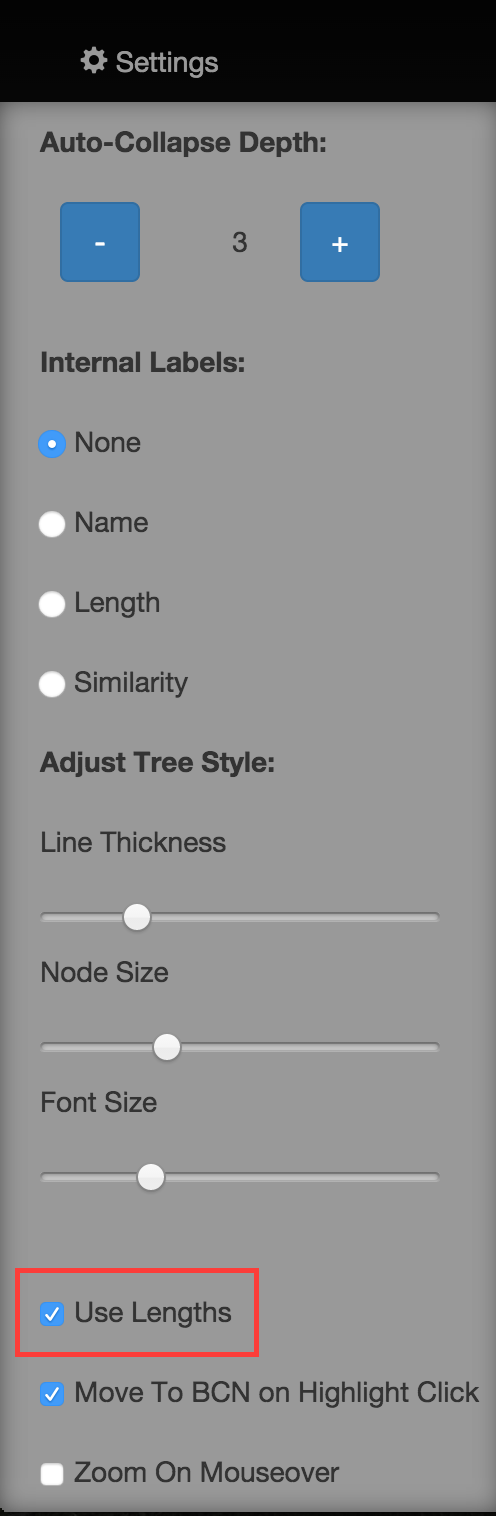
Fig. 9
Settings
There are a number of options available to change the styling of the visualisation (Fig. 10) as well as the text displayed on internal nodes (Fig.11). Changing these settings will cause the visualisation to update in real time.
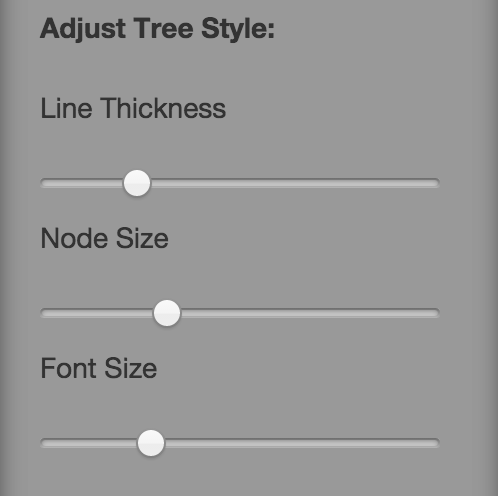
Fig. 10
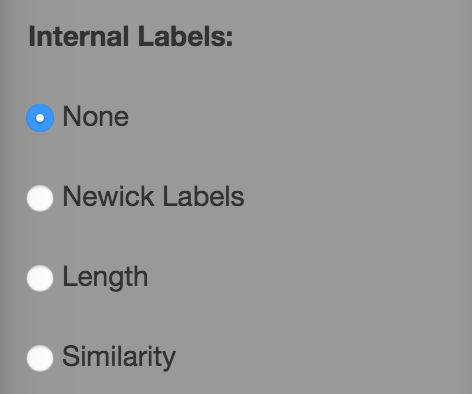
Fig. 11
Comparing Trees
To compare two trees, put Phylo.io in comparison mode by clicking 'Compare' at the top of the sidebar (Fig. 12). Then, enter the Newick for your two trees in the boxes provided. The trees will appear in the viewing area coloured according to each node's simialrity to it's best corresponding node in the opposing tree (Fig. 13). The metric of comparison is a variant of the Jaccard Index. A colour scale for the comparison metric will appear in the sidebar. A score of 1 denotes the subtree structure of the node is identical to the subtree structure of its best corresponding node, shown in (A). (B) Two new functions in the center of the tree visualisation allow to quickly find the best corresponding rooting and leaf-order between the two trees, explained in detail below.
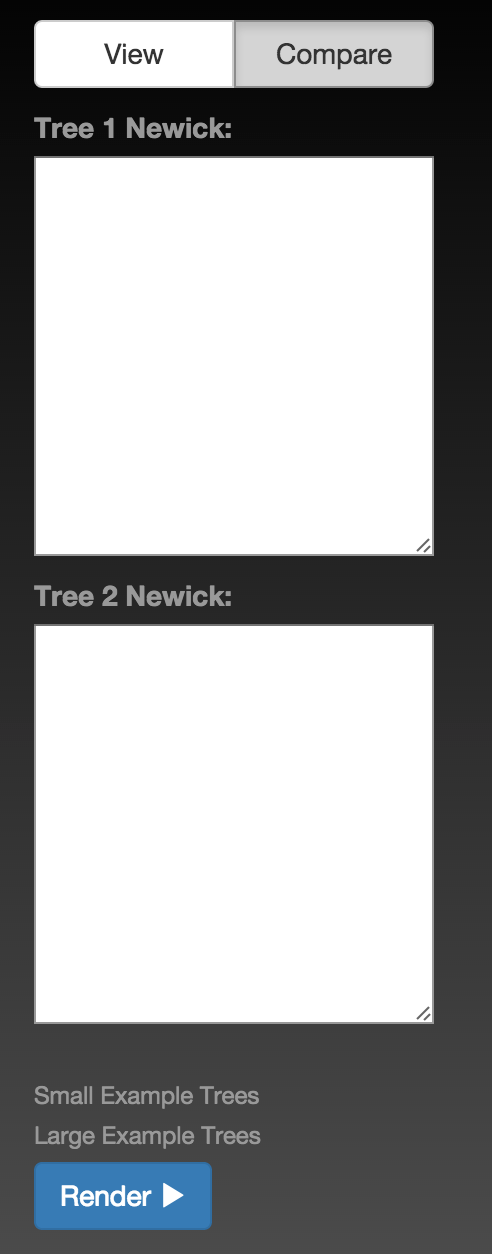
Fig. 12
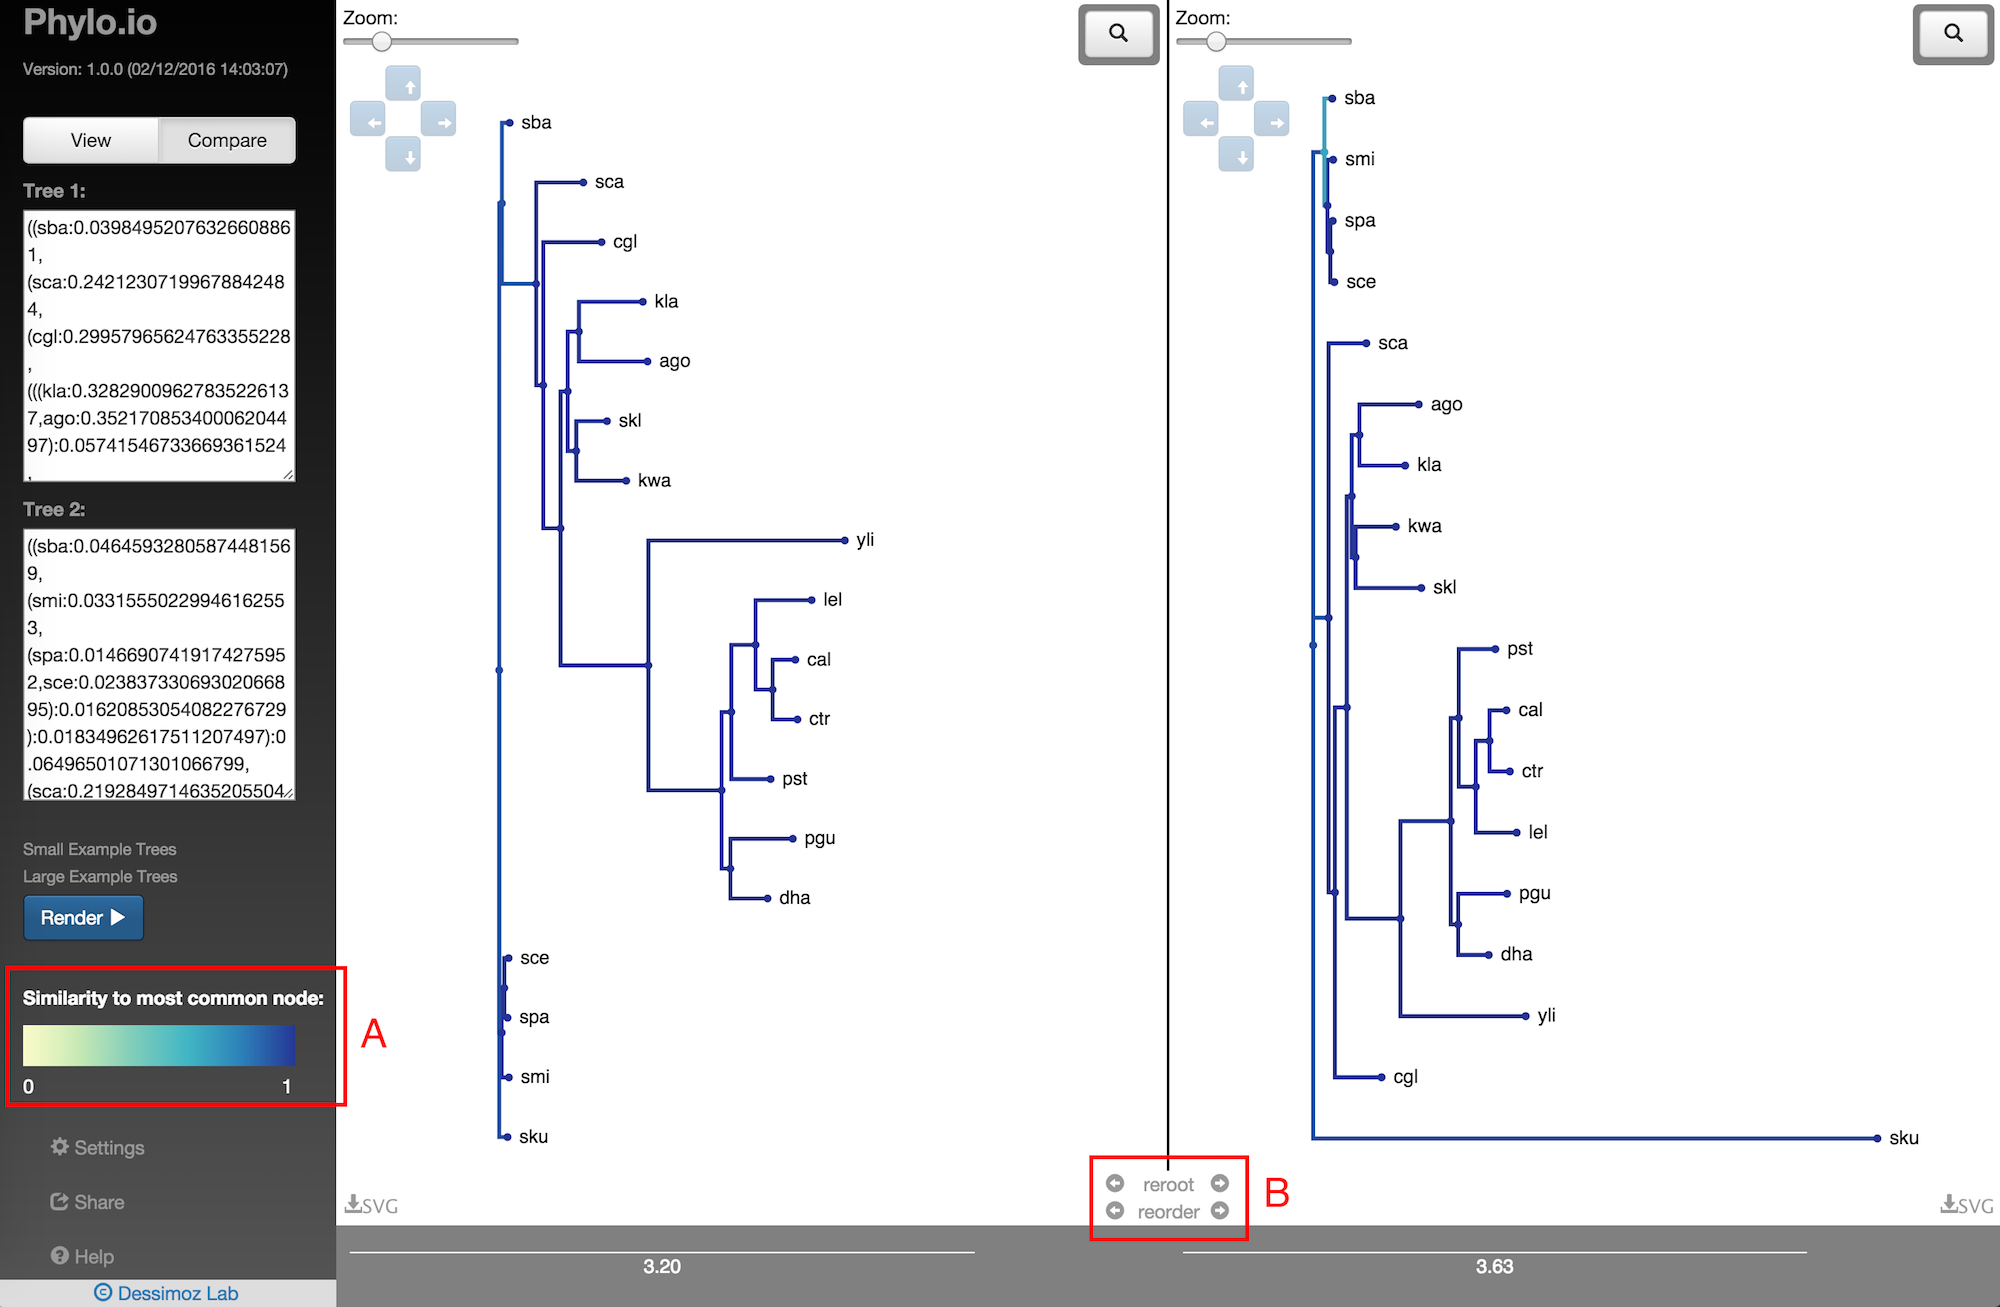
Fig. 13
When comparing two trees, the aforementioned visualisation controls can all be used independently on each tree visualisation. Furthermore, an extra option, 'highlight', becomes available when a node is clicked (Fig. 14). This will highlight the best corresponding node for that node in the opposing tree (Fig. 15). Also, the leaves that feature in the highlighted subtree in the clicked tree will be coloured green in the opposing tree. The opposing tree visualisation will be moved to bring the corresponding node to the center, you can disable this behaviour by deselecting 'Move To BCN on Highlight Click' in the Settings Panel.
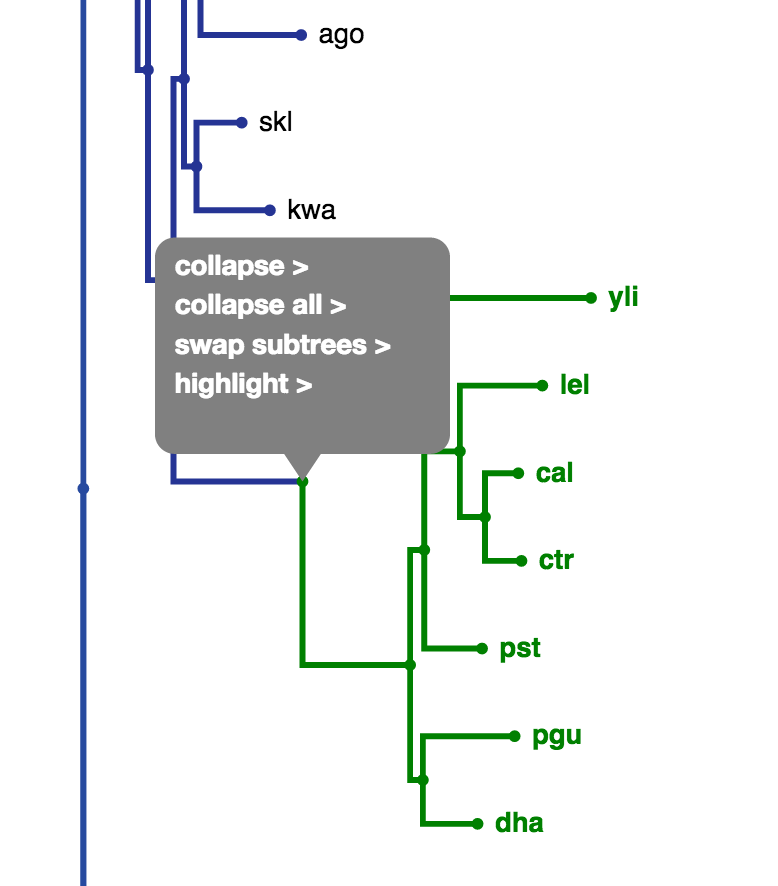
Fig. 14
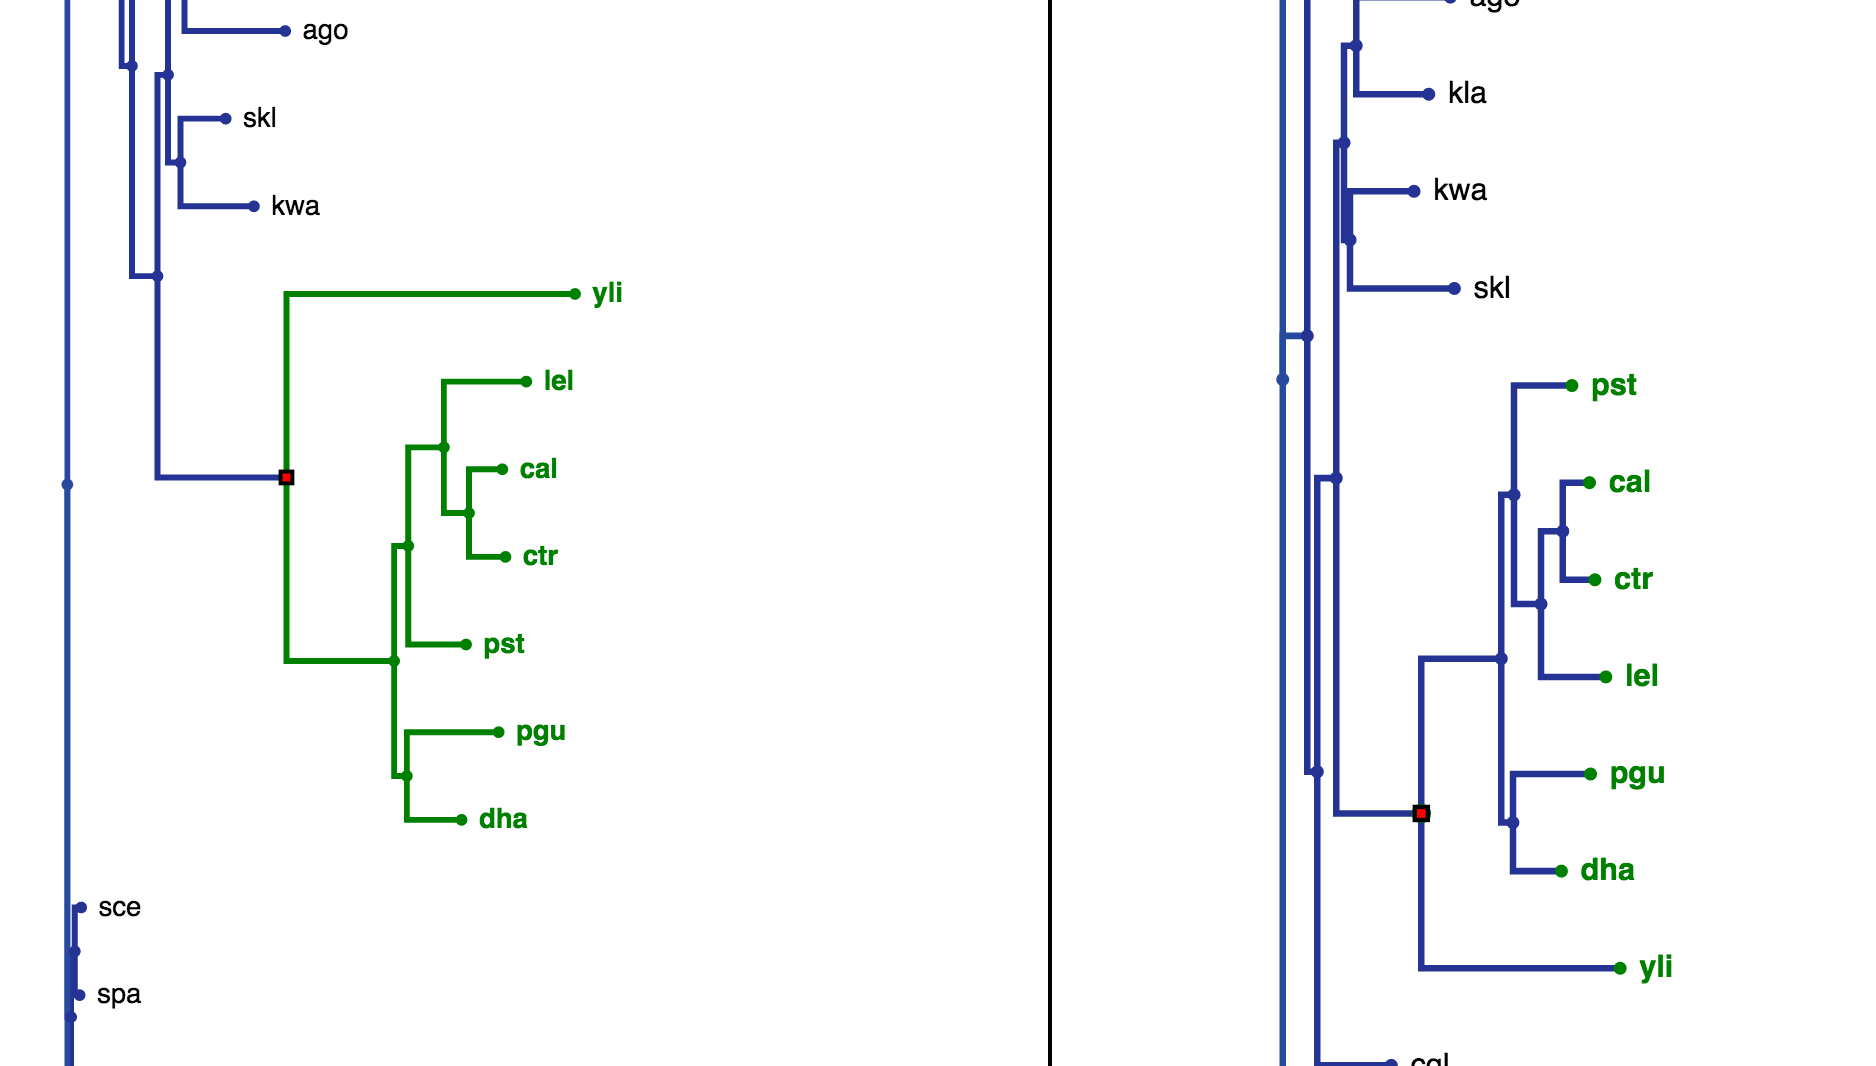
Fig. 15
If all leaves in a collapsed node in the opposing tree are children of the highlighted node in the clicked tree, the label for that collapsed node will be coloured dark green as seen in the right tree in Fig. 16. If the leaves of a collapsed node contain just some subset of the highlighted nodes leaves, the label will be coloured light green as seen in the right tree in Fig. 17.
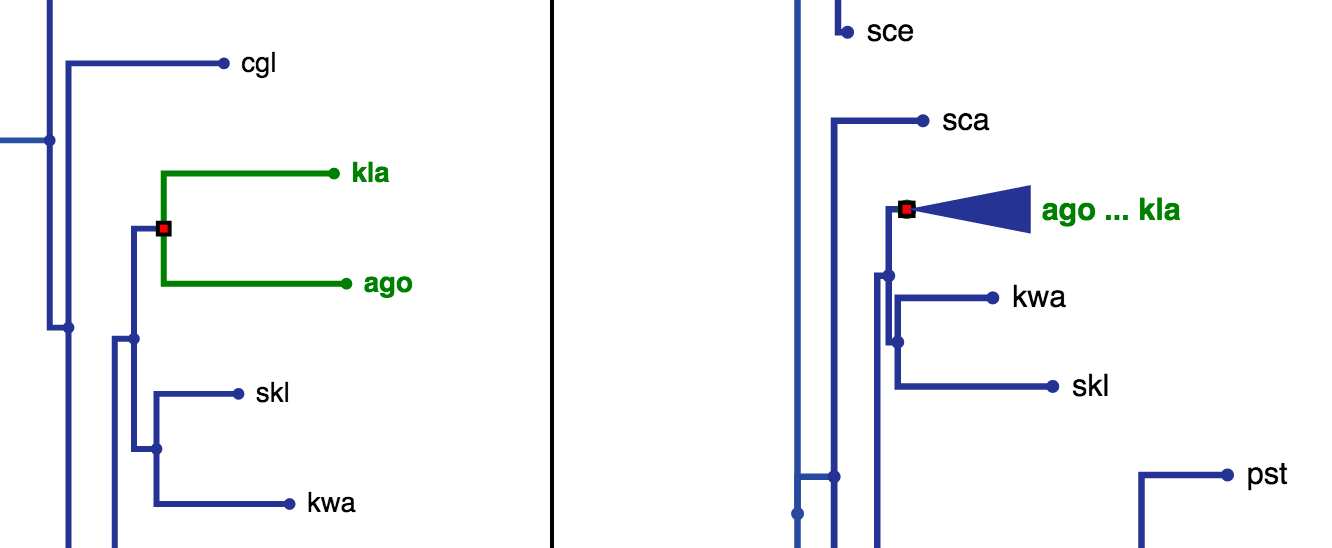
Fig. 16
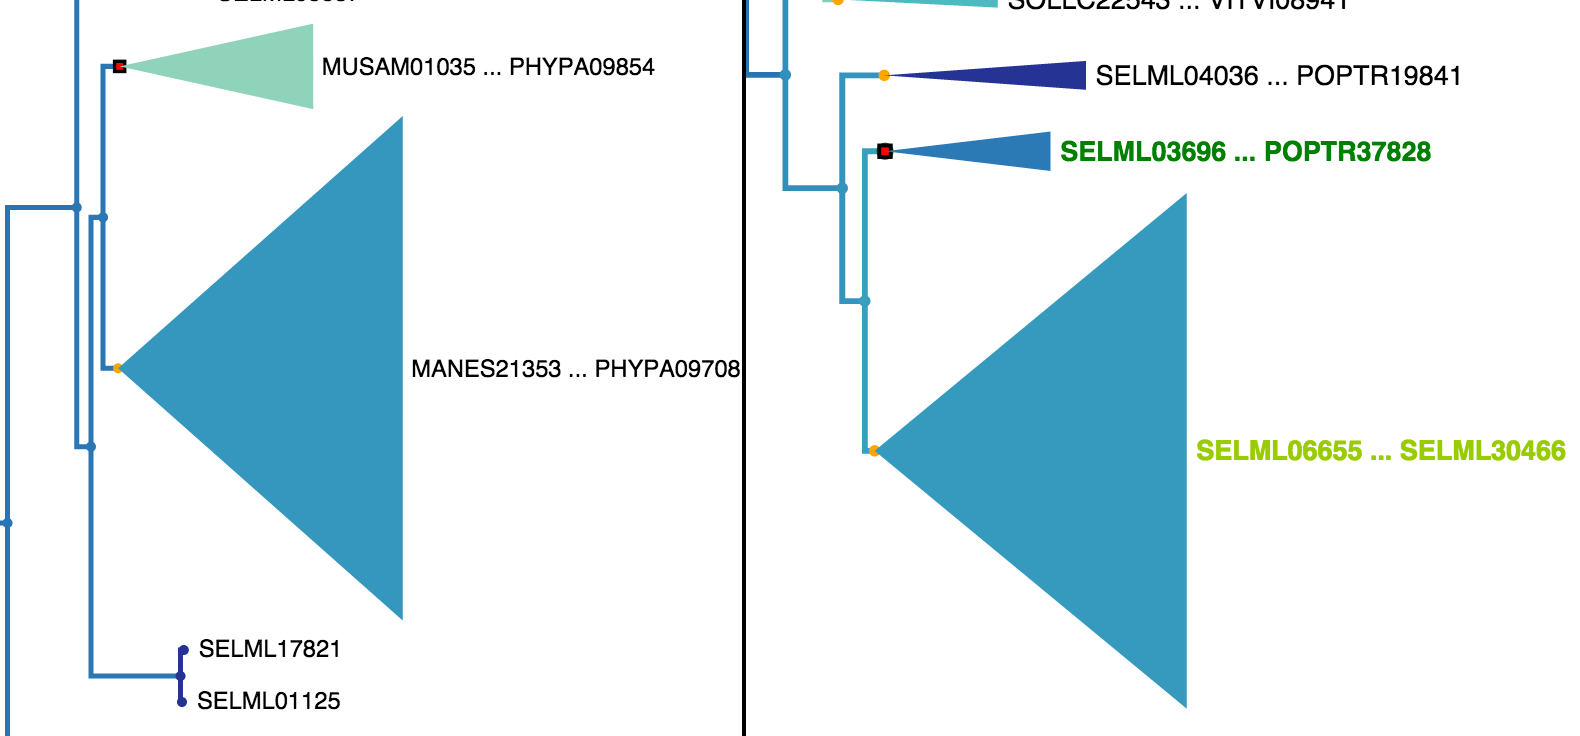
Fig. 17
In order to quickly find the best corresponding visualisation of two trees, the functions reroot and reorder can be employed. Both ensure that the same rooting and same leaf order is found based on a fixed tree, as shown in Fig. 18 - Fig. 22. There a highlighted node is first used as root point and then the opposite tree is rerooted automatically with the same root and the leaf order is adjusted. Using finally the collapse functionality makes it possible to quickly find a representation that is very similar.
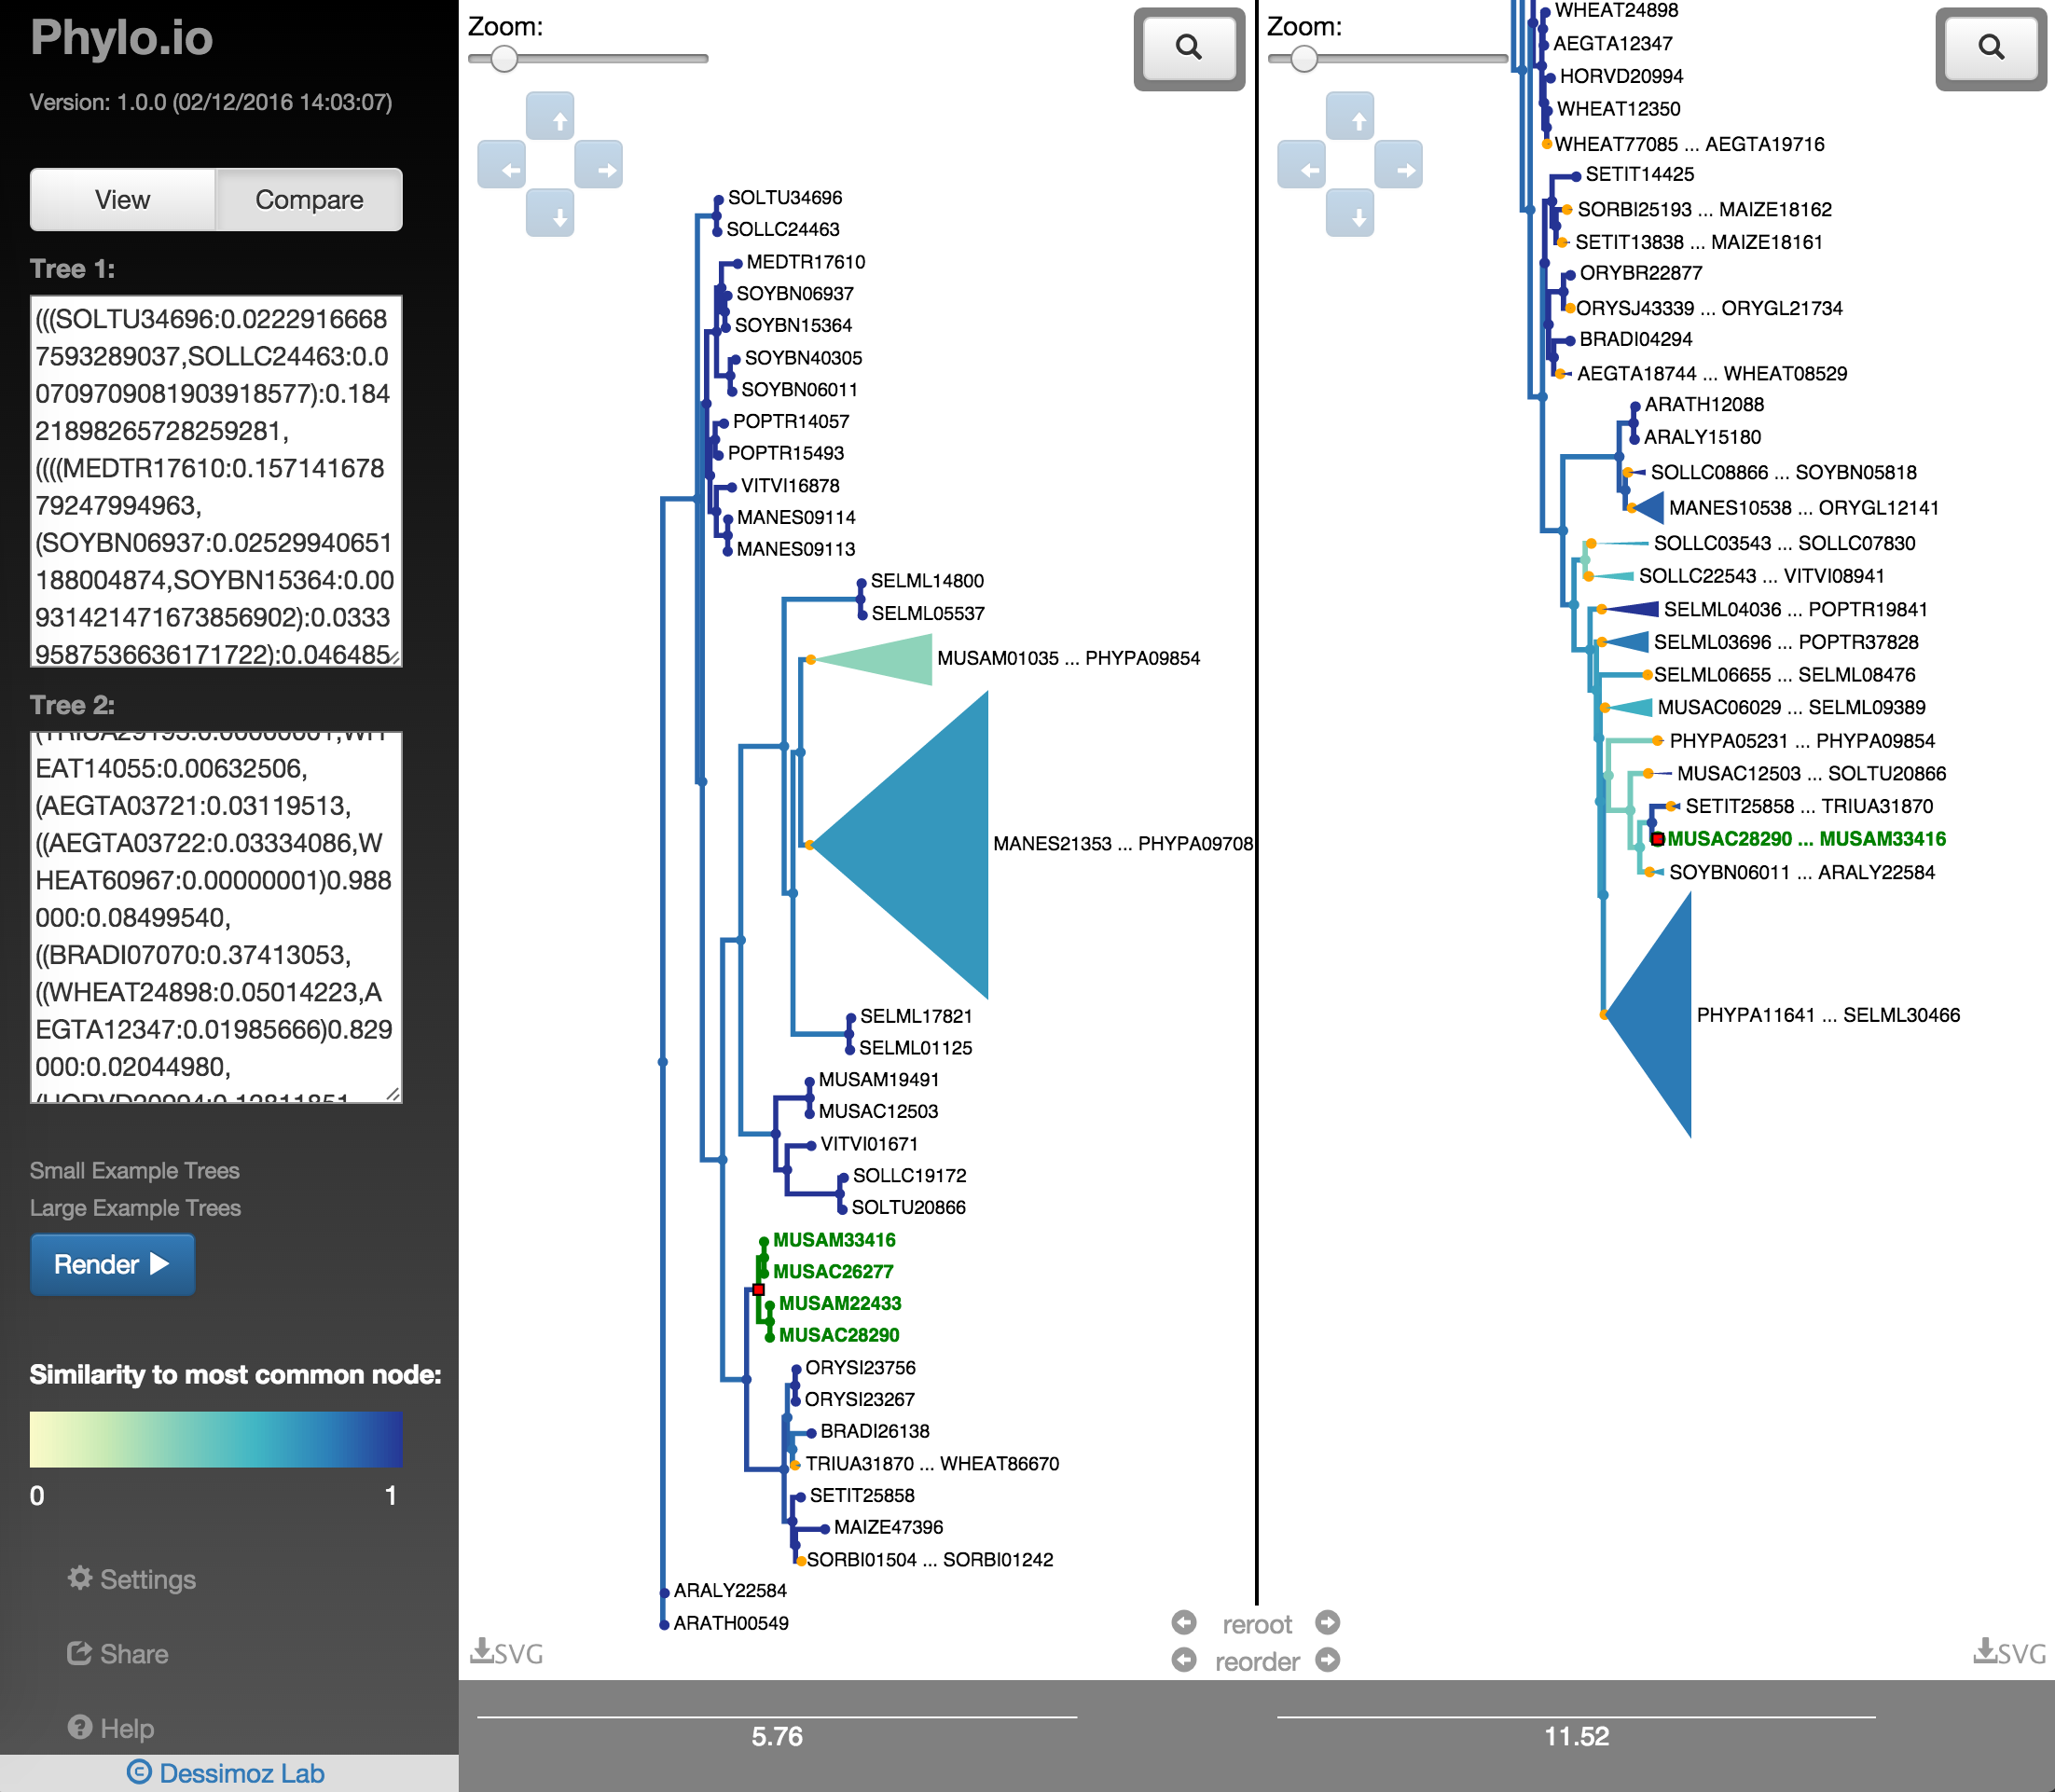
Fig. 18
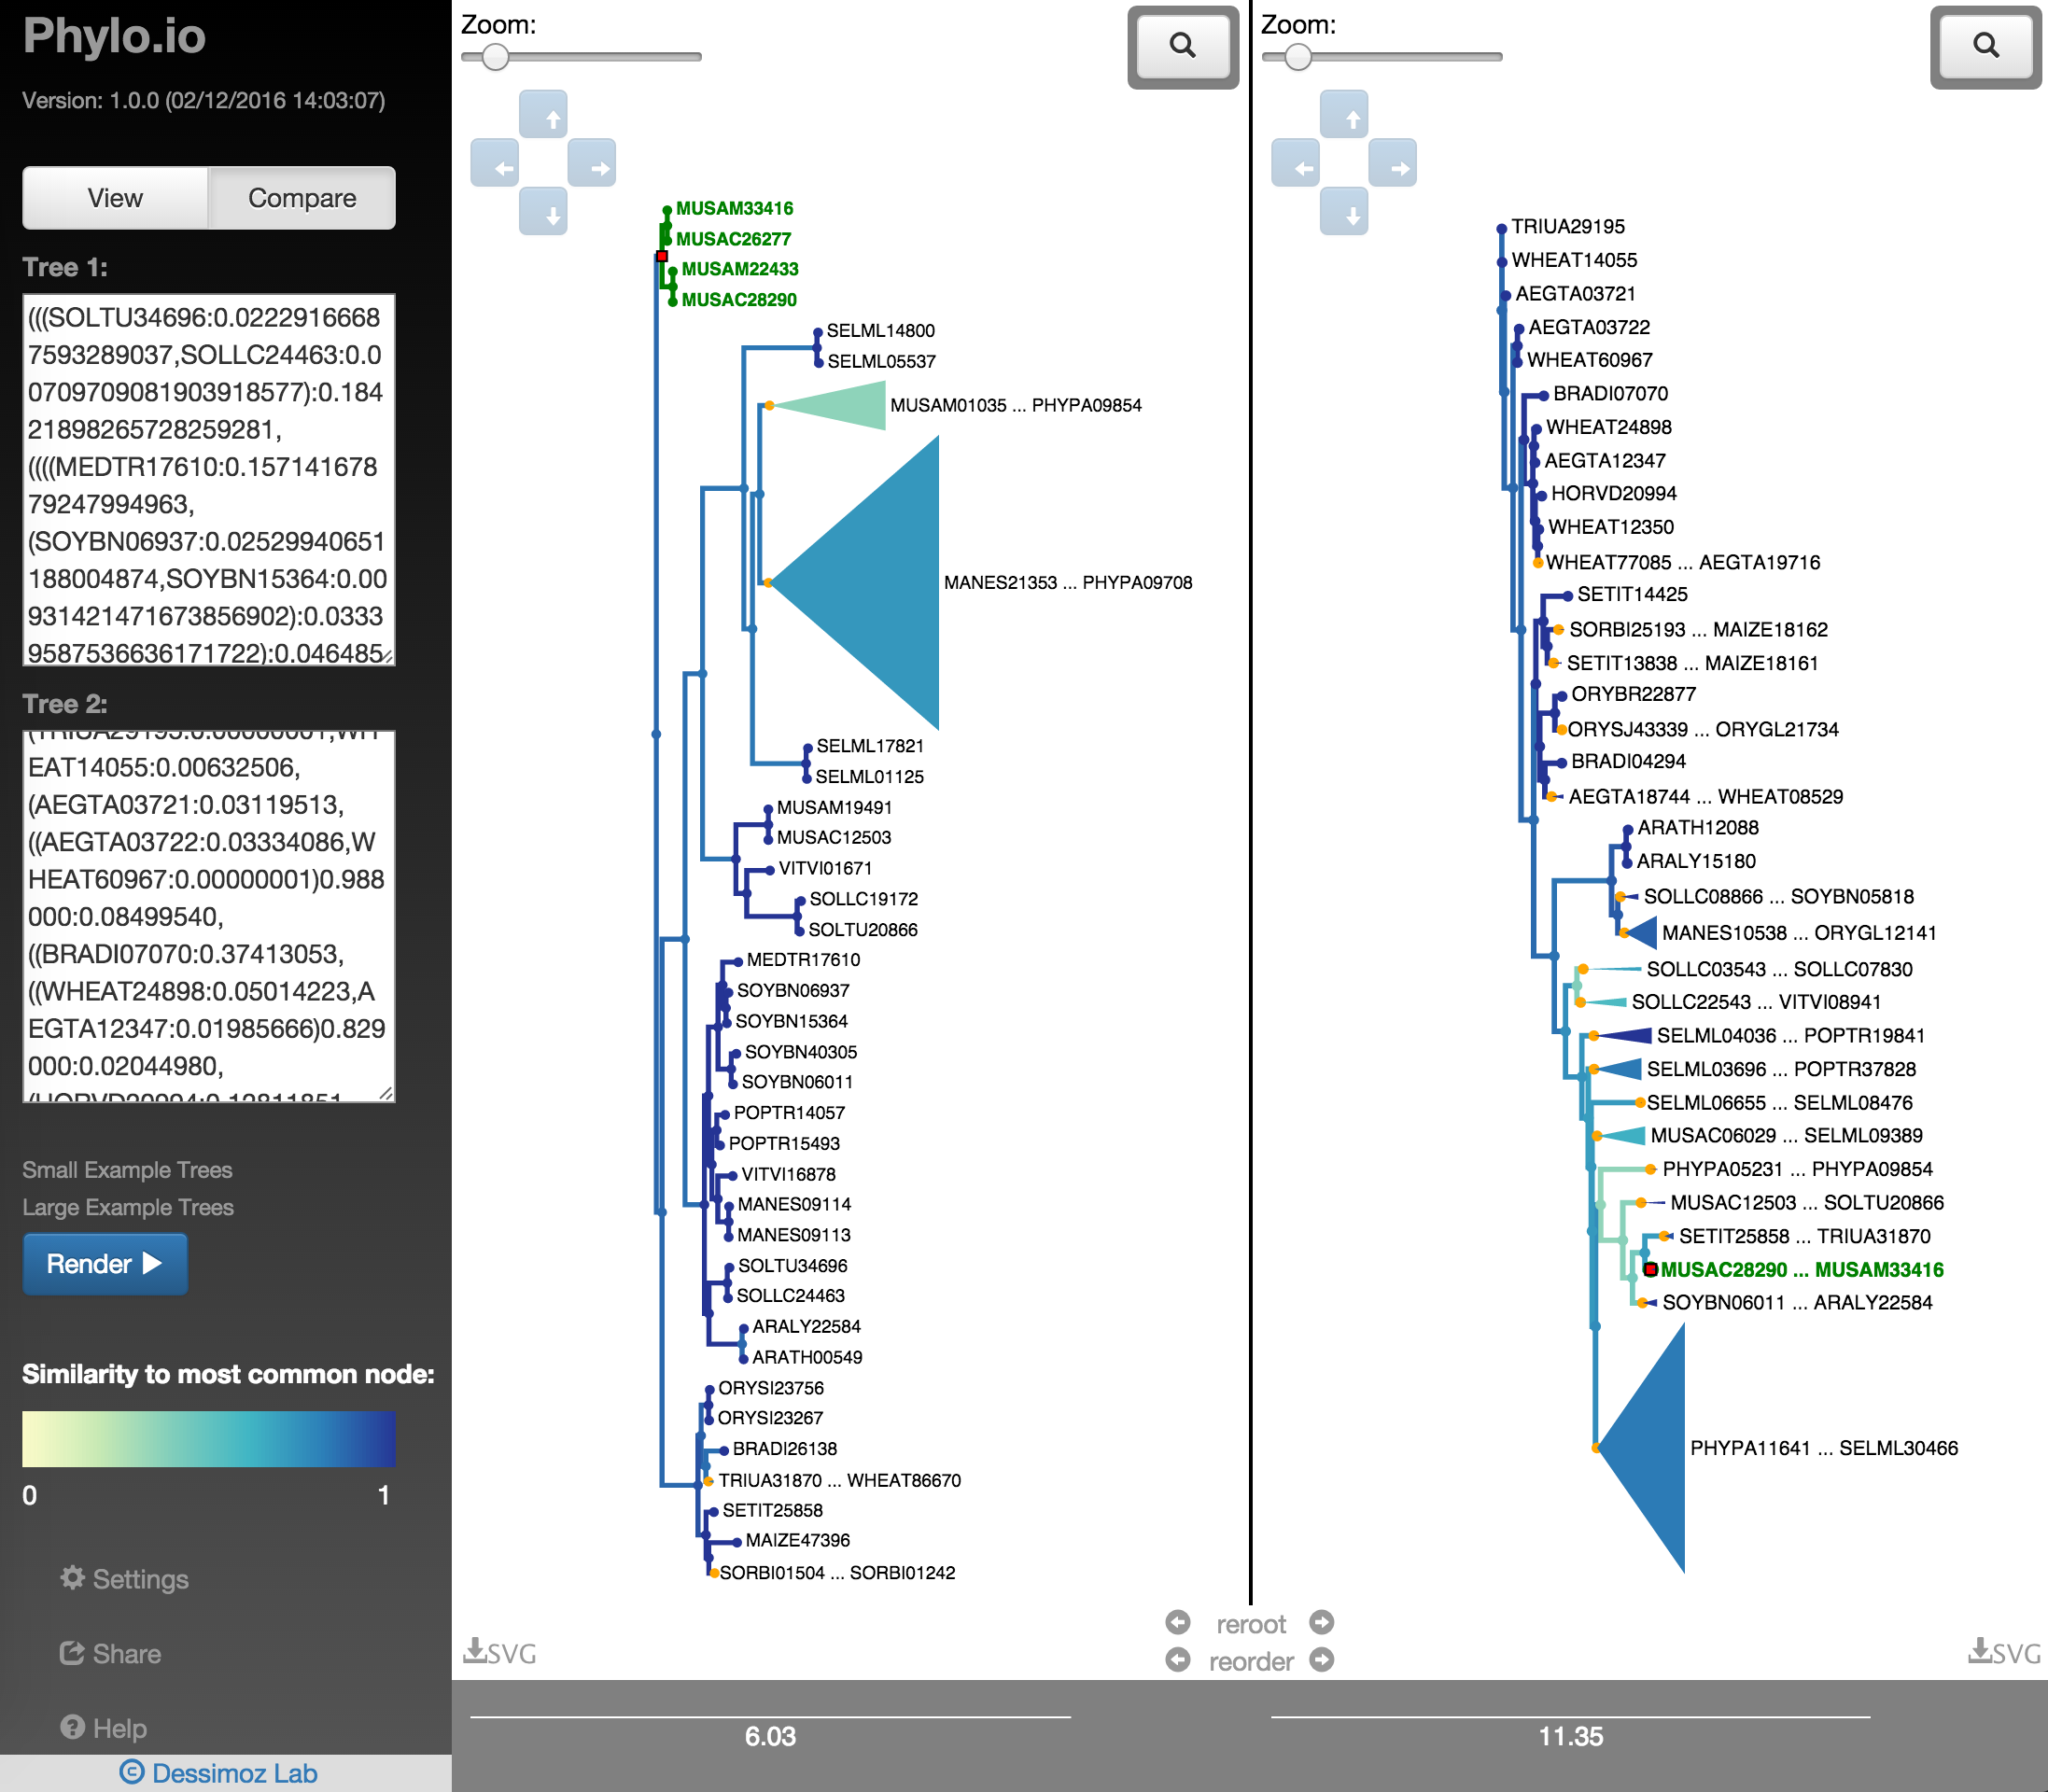
Fig. 19
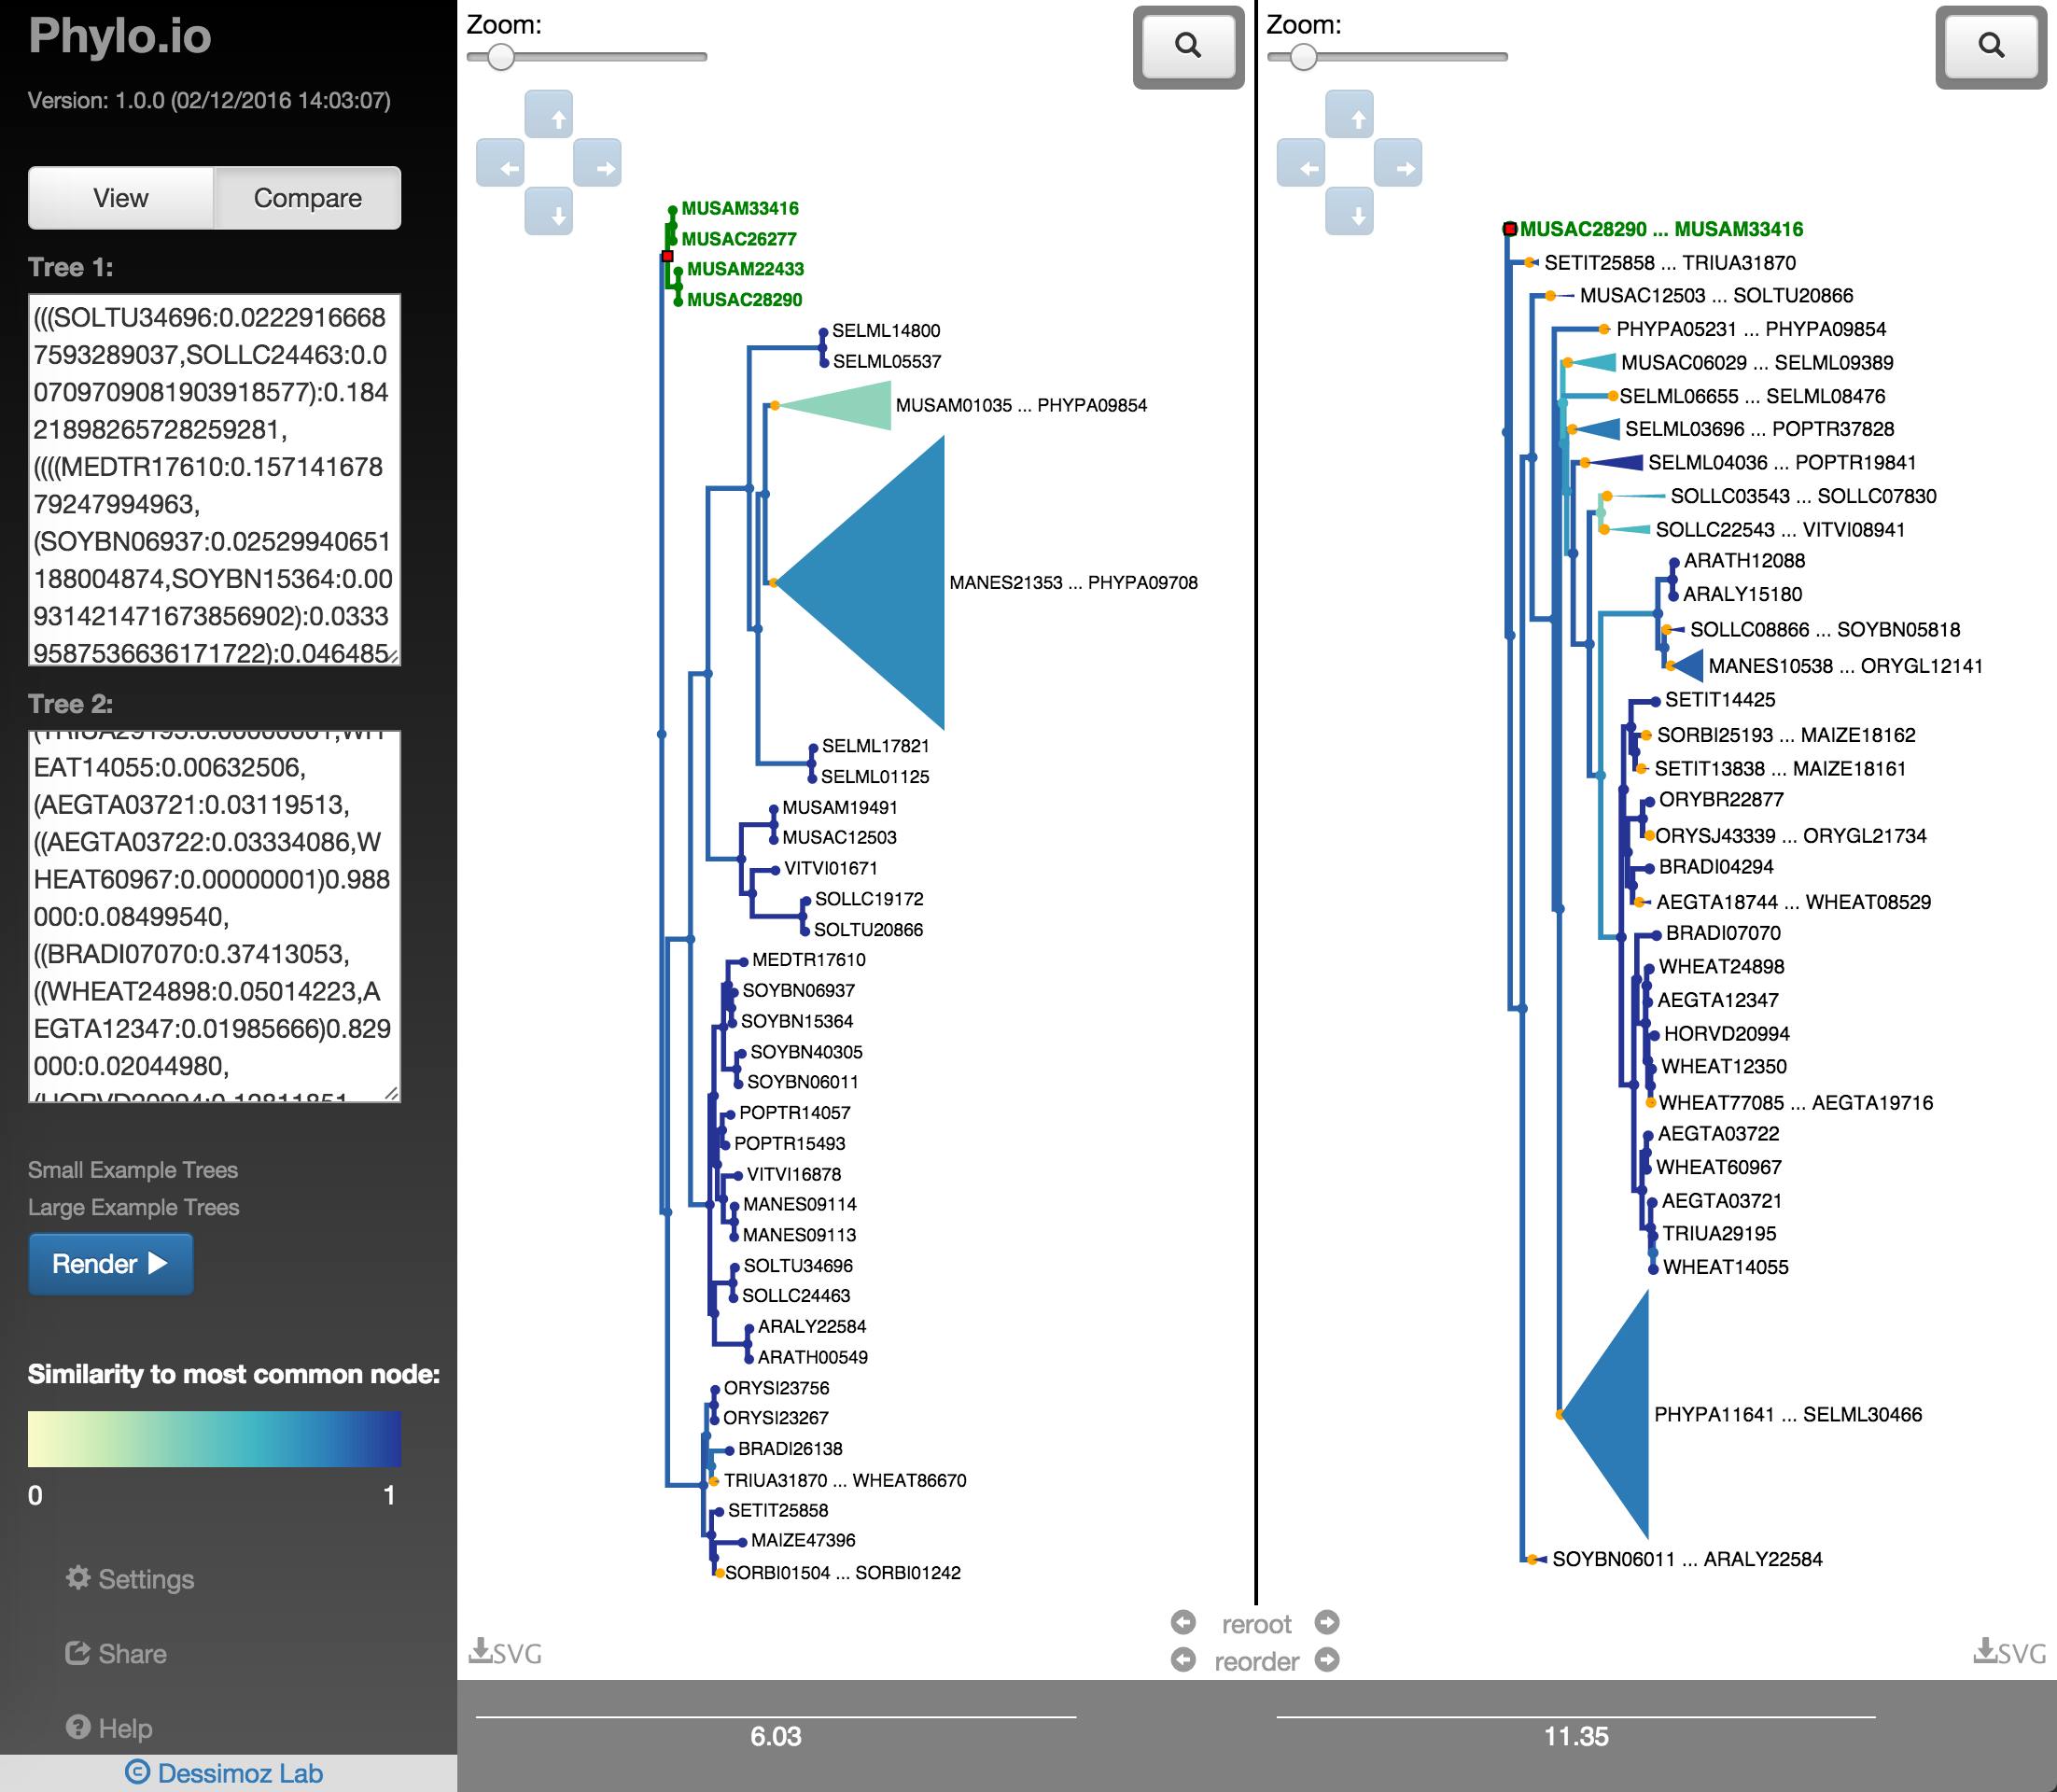
Fig. 20
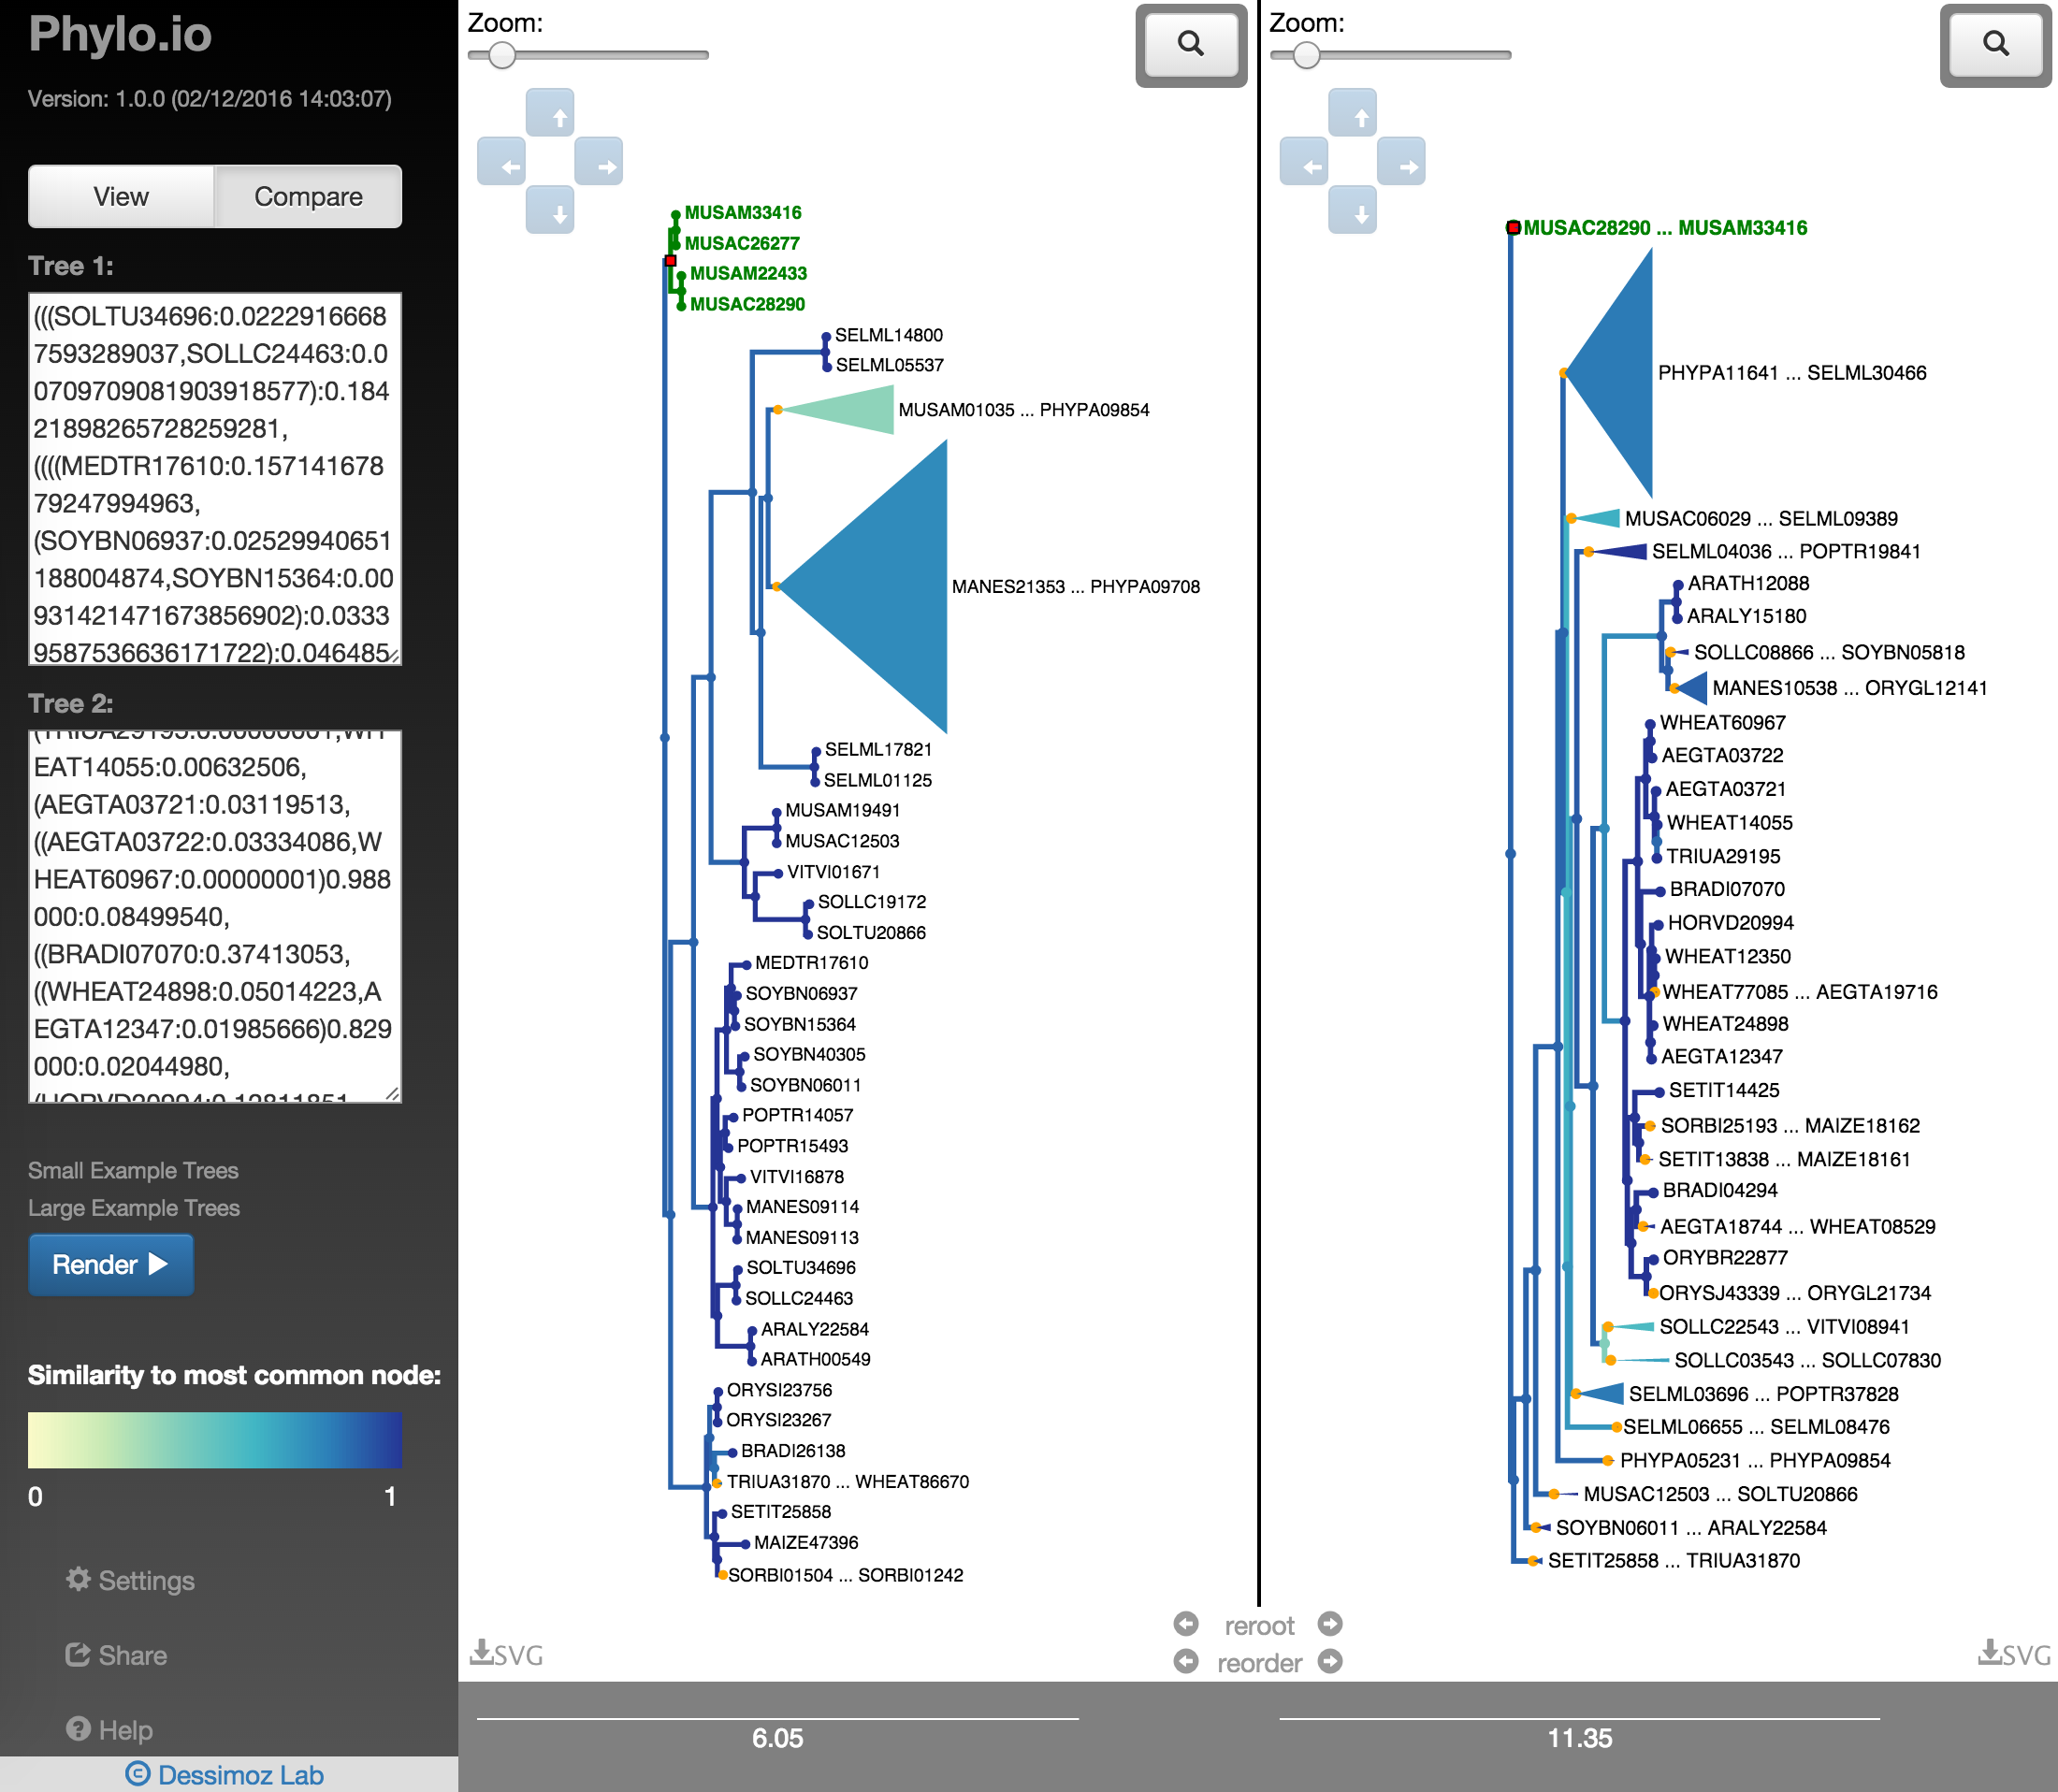
Fig. 21
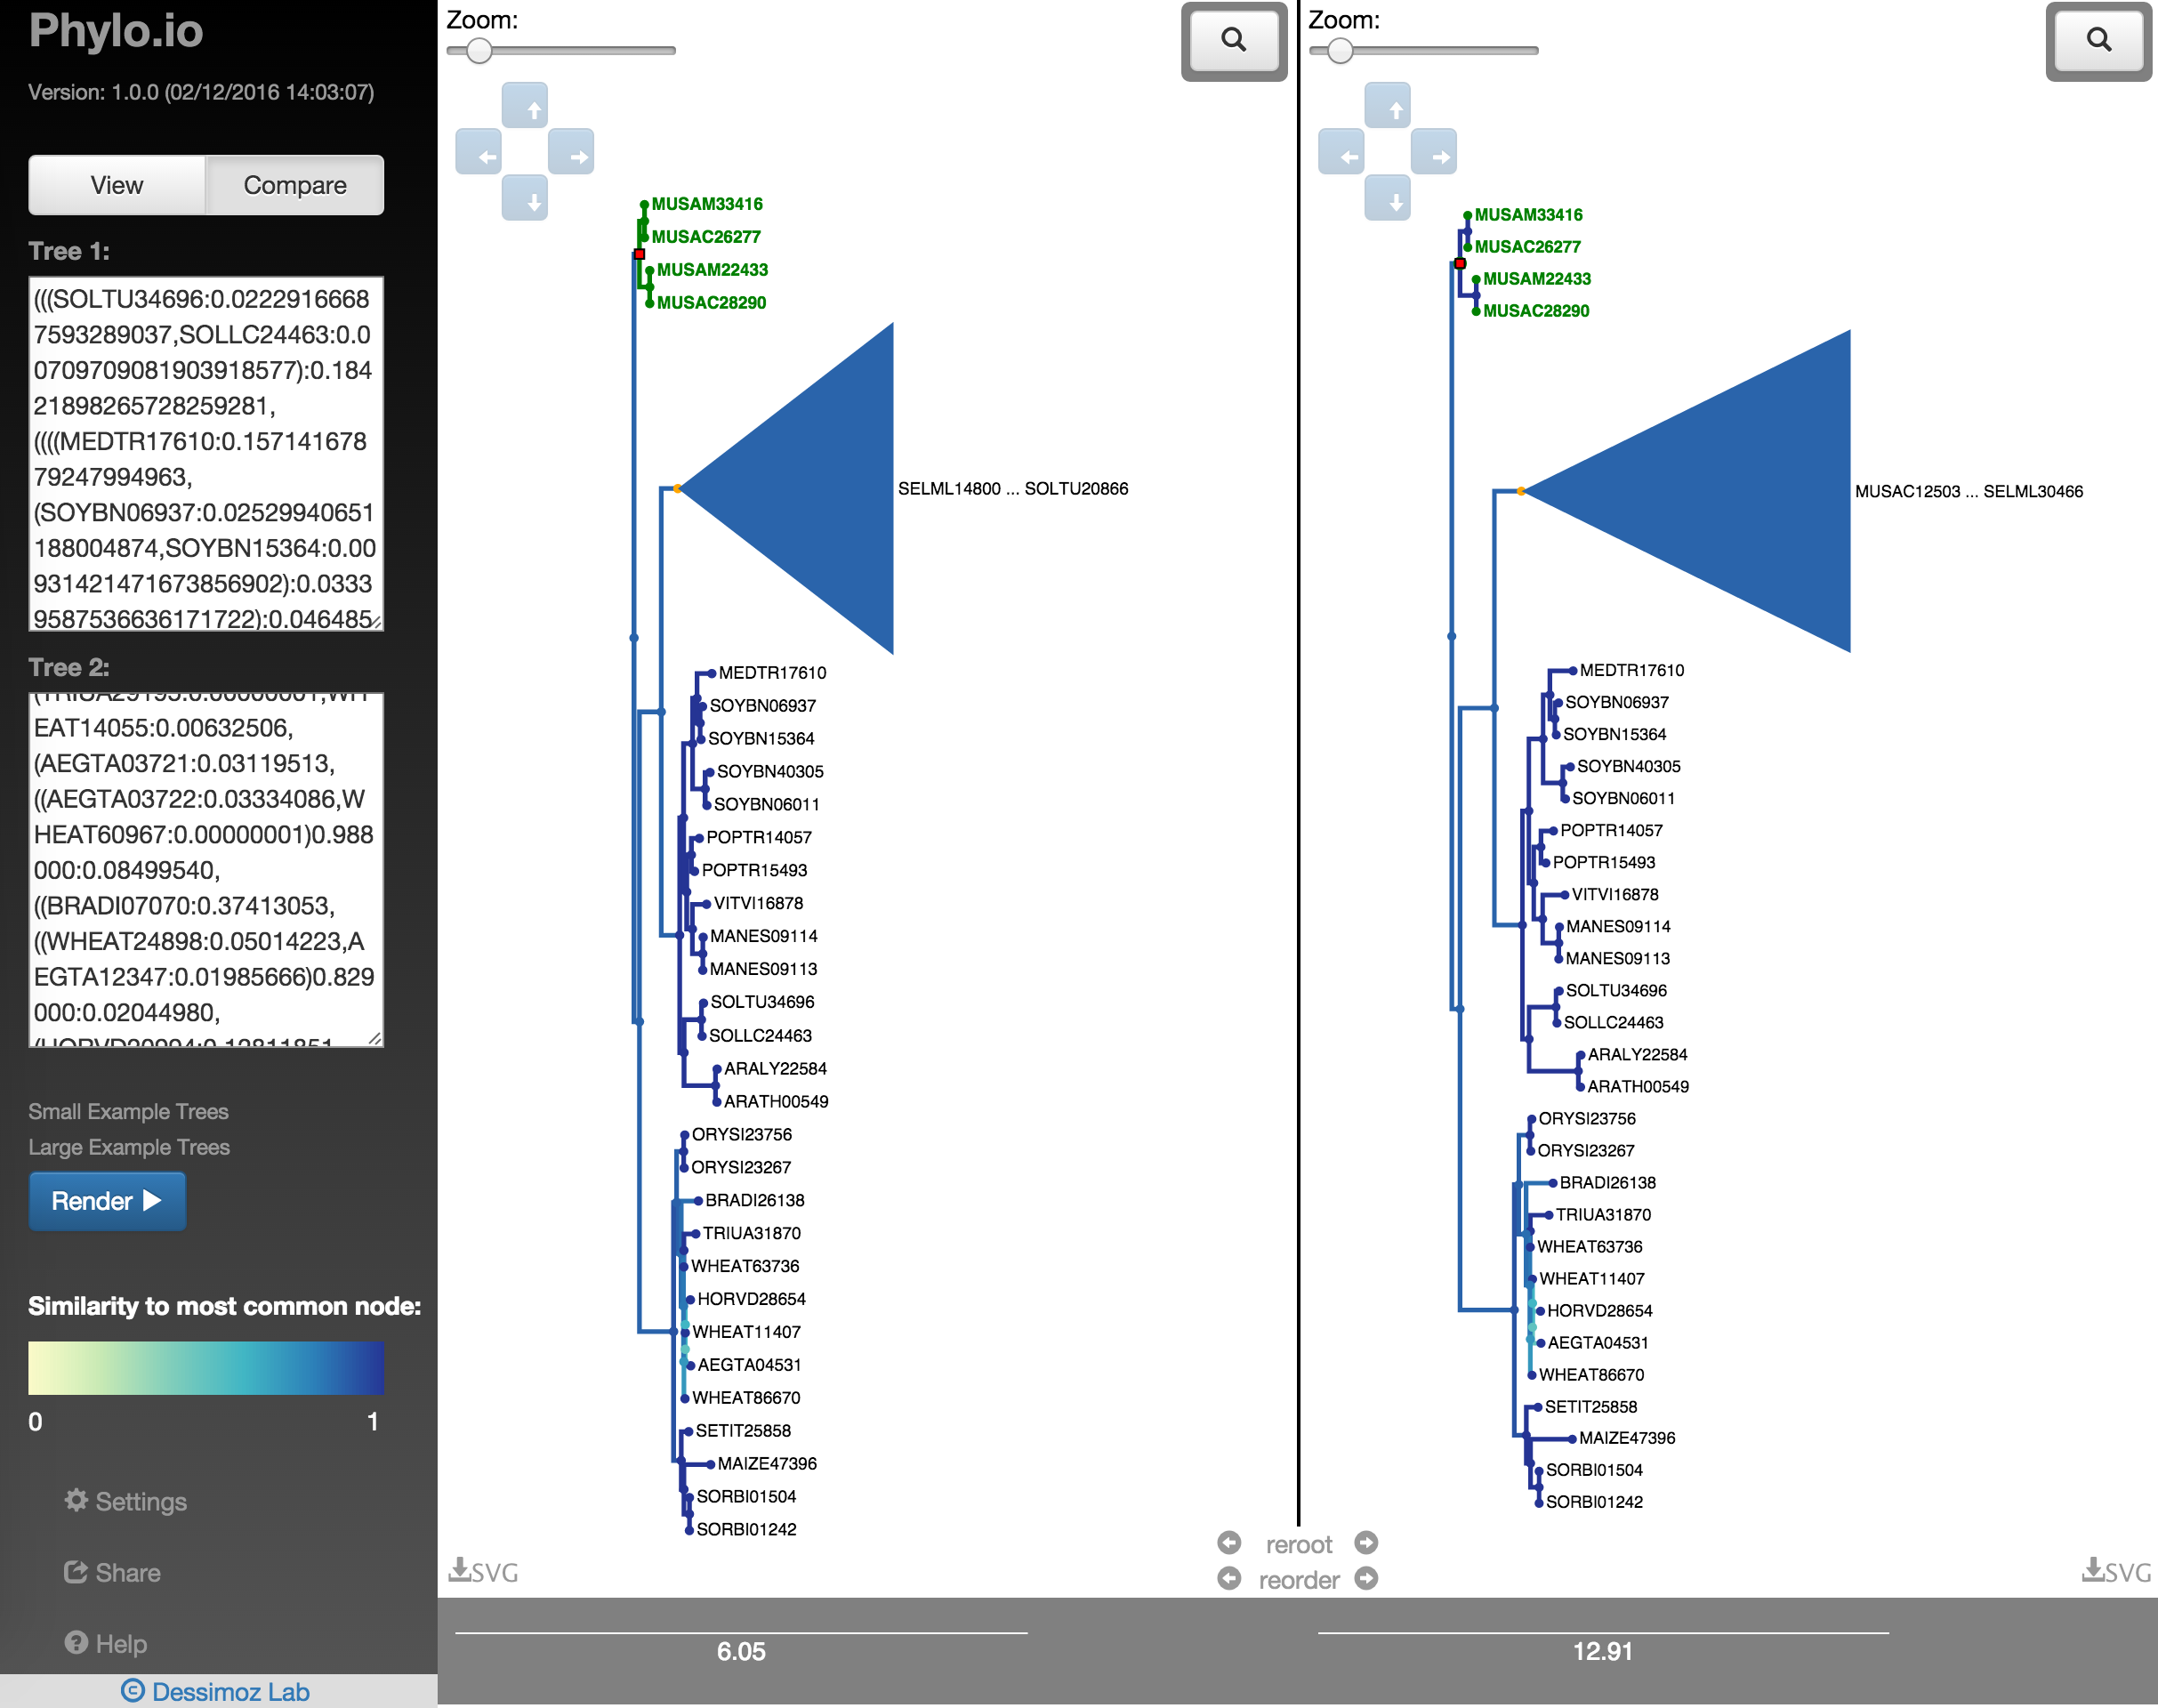
Fig. 22